Download
1 / 1
10 likes | 110 Vues
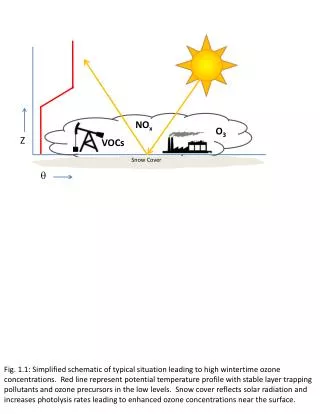
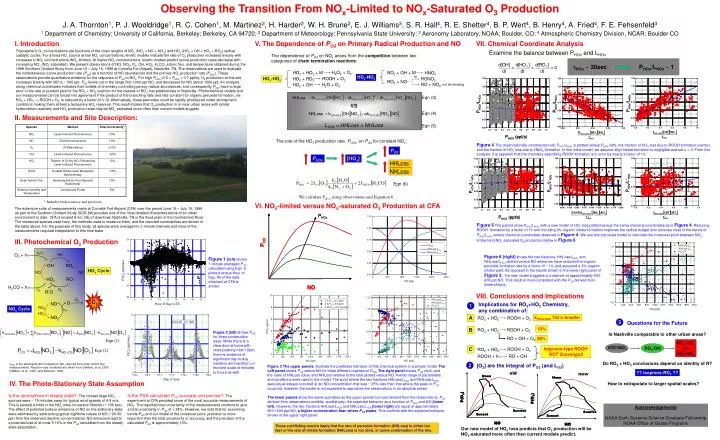
Investigating the relationship between NOx and ozone production through chemical analysis in Nashville urban area. Findings suggest possible errors in current models and implications for understanding ozone production in urban environments.

E N D
RH A ROOH + O2 RO2 + HO2 HOx-HOx vs. HOx-NOx OH RO2 VOC/NOx RO2/OH NO NO HOx-HOx RO HO2 HOx ~ 30sec PHOx/LHOx ~ 1 O2 RO M HOx-NOx RO + OH ROOH + h VS LHOx = HHLoss + NHLoss PO3 PHOx [HOx] Eqn (6) H2O2 + O2 HO2 + HO2 + M ROOH + O2 HO2 + RO2 H2O + O2 HO2 + OH H2O O3 + h NO2 + OH + M HNO3 RONO2 RO2 + NO HOx Cycle RO + NO2 not terminating H2CO + h O2 Implications for RO2+HO2 Chemistry, any combination of: O2 O3 O NO kHO2+RO2 10x’s Smaller RO2 NOx Cycle h HO2 NO2 10% B ROOH + O2 RO2 + HO2 Questions for the Future RO + OH + O2 90% Is Nashville comparable to other urban areas? C Isoprene-type ROOH NOT Scavenged ROOH + O2 RO2 + HO2 Do RO2 + HO2 conclusions depend on identity of R? ?? isoprene-RO2 ?? How to extrapolate to larger spatial scales? Observing the Transition From NOx-Limited to NOx-Saturated O3 Production J. A. Thornton1, P. J. Wooldridge1, R. C. Cohen1, M. Martinez2, H. Harder2, W. H. Brune2, E. J. Williams3, S. R. Hall4, R. E. Shetter4, B. P. Wert4, B. Henry4, A. Fried4, F. E. Fehsenfeld3 1 Department of Chemistry; University of California, Berkeley; Berkeley, CA 94720; 2 Department of Meteorology; Pennsylvania State University; 3 Aeronomy Laboratory, NOAA; Boulder, CO; 4 Atmospheric Chemistry Division, NCAR; Boulder CO I. Introduction V. The Dependence of PO3 on Primary Radical Production and NO VII. Chemical Coordinate Analysis Tropospheric O3 concentrations are functions of the chain lengths of NOx (NOx NO + NO2) and HOx (HOx OH + HO2 + RO2) radical catalytic cycles. For a fixed HOx source at low NOx concentrations, kinetic models indicate the rate of O3 production increases linearly with increases in NOx concentrations (NOx-limited). At higher NOx concentrations, kinetic models predict ozone production rates decrease with increasing NOx (NOx-saturated). We present observations of NO, NO2, O3, OH, HO2, H2CO, actinic flux, and temperature obtained during the 1999 Southern Oxidant Study from June 15 – July 15, 1999 at Cornelia Fort Airpark, Nashville, TN. The observations are used to evaluate the instantaneous ozone production rate (PO3) as a function of NO abundances and the primary HOx production rate (PHOx). These observations provide quantitative evidence for the response of PO3 to NOx. For high PHOx (0.5 < PHOx < 0.7 ppt/s), O3 production at this site increases linearly with NO to ~ 500 ppt. PO3 levels out in the range 500-1000 ppt NO, and decreases for NO above 1000 ppt. An analysis along chemical coordinates indicates that models of chemistry controlling peroxy radical abundances, and consequently PO3, have a large error in the rate or product yield of the RO2 + HO2 reaction for the classes of RO2 that predominate in Nashville. Photochemical models and our measurements can be forced into agreement if the product of the branching ratio and rate constant for organic peroxide formation, via RO2 + HO2 ROOH + O2, is reduced by a factor of 3-12. Alternatively, these peroxides could be rapidly photolyzed under atmospheric conditions making them at best a temporary HOx reservoir. This result implies that O3 production in or near urban areas with similar hydrocarbon reactivity and HOx production rates may be NOx-saturated more often than current models suggest. Examine the balance between PHOx and LHOx The dependence of PO3 on NOx arises from the competition between two categories of chain termination reactions: Eqn (3) Eqn (4) II. Measurements and Site Description: Eqn (5) The role of the HOx production rate, PHOx, on PO3 for constant NOx: Figure 4The observationally constrained ratio PHOx/LHOx is plotted versus PHOx(left), the fraction of HOx loss due to ROOH formation (center), and the fraction of HOx loss due to HNO3 formation. In this initial model, we assume alkyl nitrate formation is negligible and set = 0. From this analysis, it is apparent that the chemistry describing ROOH formation is in error by nearly a factor of 10. We calculate PHOxusing observations and Equation 6. * Includes both accuracy and precision VI. NOx-limited versus NOx-saturated O3 Production at CFA The extensive suite of measurements made at Cornelia Fort Airpark (CFA) over the period June 15 – July 15, 1999 as part of the Southern Oxidant Study (SOS 99) provides one of the most detailed characterizations of an urban environment to date. CFA is located 8 km, NE of downtown Nashville, TN in the flood plain of the Cumberland River. The measured species used here, the methods used to measure them, and the reported uncertainties are shown in the table above. For the purposes of this study, all species were averaged to 1-minute intervals and none of the measurements required interpolation to this time base. Figure 5 The panels show PHOx/LHOx with a new model of HOx loss plotted versus the same chemical coordinates as in Figure 4. Reducing ROOH formation by a factor of 10 and including 3% organic nitrate formation improves the radical budget and removes most of the trends of PHOx/LHOx versus chemical coordinates observed in Figure 4. We use this improved model to calculate the crossover point between NOx-limited and NOx-saturated O3 production below in Figure 6. III. Photochemical O3 Production Figure 6 (right) shows the two fractions, HHLoss/LHOx and NHLoss/LHOx plotted versus NO where we have reduced the organic peroxide formation rate by a factor of ~ 10, and assumed a 3% organic nitrate yield. As opposed to the results shown in the lower right panel of Figure 3, the new model suggests a crossover at approximately 500-600 ppt NO. This result is more consistent with the PO3 derived from observations. Figure 1(left) shows 1-minute averaged PO3 calcuated using Eqn. 2 plotted versus Hour of Day. All of the data obtained at CFA is shown. VIII. Conclusions and Implications 1 3 Figure 2 (left) shows PO3 for three consecutive days. While there is a clear diurnal trend with rates peaking near 12pm, there is evidence of significant day-to-day variation and variation on the time scale of minutes to hours as well. Eqn (1) Eqn (2) JNO2is the photolysis rate constant for NO2 derived from solar actinic flux measurements. Reaction rate constants are taken from DeMore, et al, 2000, DeMore, et al., 1997, and Atkinson, 1994. 2 [O3] are the integral of PO3 (and LO3) Figure 3 The upper panels, illustrate the predictive behavior of this chemical system in a simple model.The Left panel shows PO3 versus NO for three different regimes of PHOxThe right panel shows PO3 (red), and the rates of HHLoss (blue) and NHLoss relative to the total plotted versus NO. A wide range of parameters and conditions were used in the model. The point where the two fractions HHLoss/LHOx and NHLoss/LHOx were equal always occurred at an NO concentration that was ~ 25% less than that where the peak in PO3 occurred, however, the model is not expected to reproduce the observations in an absolute sense. The lower panels show the same quantities as the upper panels but now derived from the observations. PO3 derived from observations exhibits, qualitatively, the expected behavior as a function of PHOx and NO (lower left). However, the two fractions HHLoss/LHOx and NHLoss/LHOx(lower right) are equal at approximately 900-1000 ppt NO, a higher concentration than where PO3peaks. This conflicts with the expected behavior shown in the upper right panel. old new IV. The Photo-Stationary State Assumption Is the atmosphere in steady state?:The closest large NOx sources were ~ 15 minutes away for typical wind speeds of 4-5 m/s. This is several e-folds in the NOx intra-conversion lifetime (~ 100 sec). The effect of potential surface emissions of NO on the stationary state were estimated by subtracting typical nighttime values of NO (~20-50 ppt) from the observed daytime concentrations. NO emissions lead to a potential bias of at most 5-10% in the PO3 calculated from the steady state assumption. Is the PSS-calculated PO3 accurate and precise?:The experiment at CFA provided some of the most accurate measurements of NO2. The reported total uncertainty of the measurements combine to give a total uncertainty in PO3 of 34%. However, we note that for examining trends PO3 and our model of the crossover point, precision is more important than the total uncertainty or accuracy, and the precision of the calculated PO3 is approximately 10%. Acknowledgements NASA Earth Systems Science Graduate Fellowship NOAA Office of Global Programs These conflicting results imply that the rate of peroxide formation (HHLoss) is either too fast or the rate of nitrate formation (NHLoss) is too slow, or some combination of the two. Our new model of HOx loss predicts that O3 production will be NOx-saturated more often than current models predict.