Download
1 / 1
10 likes | 132 Vues
Mutual Information. Diagnostic Feature Detection of Leukemia Serum Proteins in 2-200 kDa TOF-MS Spectra. Maureen B. Tracy, Dariya I. Malyarenko, Karl W. Kuschner, Eugene R. Tracy, William E. Cooke, and Dennis M. Manos College of William and Mary, Williamsburg, VA 23187-8795. Overview.

E N D
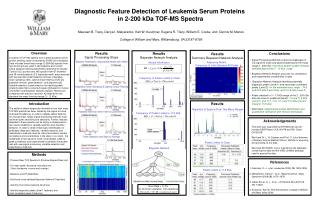
Mutual Information Diagnostic Feature Detection of Leukemia Serum Proteins in 2-200 kDa TOF-MS Spectra Maureen B. Tracy, Dariya I. Malyarenko, Karl W. Kuschner, Eugene R. Tracy, William E. Cooke, and Dennis M. Manos College of William and Mary, Williamsburg, VA 23187-8795 Overview Results Signal Processing Steps Conclusions Results Bayesian Network Analysis Results Summary Bayesian Network Analysis A subset of TOF-MS spectra from a 2004 leukemia serum protein profiling study conducted by EVMS [1] is analyzed. Data includes broad mass range (2-200kDa) spectra from two clinical groups, adult T-cell leukemia and normal. Using signal processing parameters optimized for Quality Control (QC) pooled sera, MS spectra from 67 leukemia and 78 normal patients (2-3 replicates each) are processed with exponential-model baseline removal, integrative down-sampling (IDS), optimal linear filtering (OLF) [2], pedestal removal, peak detection, and alignment [3]. Variable selection is performed on the resulting peak-intensity data matrix using techniques [4] based on mutual information and Bayesian network analysis. Results are compared with previous results [1,4] obtained for the standard low mass focusing range (3 - 12 kDa). • Signal Processing Methods overcome challenges of low signal-to-noise and peak broadening for the mass range 2 - 200 kDa: more than double number of peaks detected beyond the 3 - 12 kDa range • Bayesian Network Analysis accounts for correlations and experimental uncertainties in data. • Bayesian Network Analysis identifies potentially diagnostic peaks (Level 1) and secondary correlated peaks (Level 2): for the extended mass range - 74.6 and 20.5 kDa (Level One), and 131.9 kDa (Level 2) • Peaks selected in 3 – 13 kDa range of the 2 - 200 kDa data are close to published results: 7.5 and 11.5 kDa (Level 1) and 11.7, 11.9, 12.1 and 13.3 kDa (Level 2 linked to 11.5 kDa) • Next steps: experimental protein identification and quantitative verification with immuno-techniques. Adjacency Matrix: Frequency of Links Between All Peaks Frequency of Peaks Linked to Class Results Introduction The ability to obtain diagnostic information from high mass TOF-MS spectra has been limited by low signal-to-noise and peak broadening. In order to reliably detect features for a broad mass range, signal processing methods must achieve higher sensitivity and selectivity. Further, features detected in these spectra can be highly correlated which can cause instability in variable selection and classifier behavior. In order to obtain meaningful identification of potentially diagnostic features, variable selection and classification methods must be robust and able to handle correlations and uncertainties in the data. In our work, the challenges of low signal-to-noise, broad peaks, peak-to-peakcorrelations and experimental uncertainty have been met with new signal processing, variable selection and classification methods. Alignment of Spectra From Two Mass Ranges Frequency of Peaks Linked to 11.5 kDa Acknowledgements This work was supported by NIH-National Cancer Institute SBIR Phase II CA101479 and R01 Grant CA126118. We thank Dr. L. H. Cazares and Prof. O. John Semmes of Eastern Virginia Medical School, Norfolk for acquiring and providing us the data. We thank INCOGEN, Inc for maintaining the database containing the data and the VIBE software package used to access the data. Peaks Linked to Class Bayesian Network Methods • Process Raw TOF Spectra to Produce Aligned Peak List • - For each peak, discretize intensities into • 3 bins (leukemia, normal and overlap) • - Measure Joint Probabilities • - Build and cross-validate Bayesian Network Classifiers • - Identify most robust network structures • - Identify diagnostic peaks (level 1 features) and • their correlates (level 2 features) References 1. Semmes, O. J. et al, Leukemia (2005) 19, 1229-1238 2. Malyarenko, Dariya I., et al., Rapid Commun. Mass Spectrom (2006) 20, 1670–1678 3. Gatlin-Bunai, C. L., et al., J Proteome Res (2007) 6, 4517-4524 4.Kuschner, Karl W.,PhD Dissertation, College of William and Mary (May 2009) Peaks Linked to 11.5 kDa Error Rate = 11.7% 10-fold cross validation, 100 repetitions