Download
1 / 37
370 likes | 482 Vues
Equity Related Products Futures and Options. Professor Dr. Rainer Stachuletz Corporate Finance Berlin School of Economics. Futures. Long Future = Buyer. Profit. Index. 4090. Short Future = Seller. Loss. Spot – Future - Parity.

E N D
Equity Related ProductsFutures and Options Professor Dr. Rainer Stachuletz Corporate Finance Berlin School of Economics
Long Future = Buyer Profit Index 4090 Short Future = Seller Loss Spot – Future - Parity Today, one (theoretical) Index-Future is sold at 4.090 € (1€ per Index-point). Long and Short-positions can be described by a profit and loss diagram: If you are Long-Future, then you may claim for delivery of „one index“ at a price of 4090 € at the maturity of the index-future. That means, if the index at delivery is quoted at more than 4090, you will win from your futures position.
Spot – Future - Parity You hold an Index-Portfolio, currently valued at 5,500 € (1 Index-point = 1 €). If the annual risk free rate rf is at 3.5 % and the expected dividends on your Index portfolio are at 100 € (d = 100/5,500) , an Index – Future with one year to maturity has a fair price of: To prevent our Index-Portfolio from losses, we could hedge the price risk by taking a short – future position (selling a future at 5,592.40).
Profit Short Future Index 5692,40 Loss Spot – Future - Parity The total expected payoffs from your portfolio will depend on the future state of the environment (see below payoffs 1-5). A decreasing stock market will be compensated by profits from the short future position, increasing stock prices will be outbalanced by losses due to payment obligations from the future.
Spot – Future - Parity Initially you have paid 5,500 € for your stock portfolio. Taking the short future position, the final outcome of your portfolio will be 5,692,40 €, whatever the stock price will be, i.e. you will earn 192,40 which equals 3.5%. Obviously, this profit is riskless: Spot-Future- Parity
Spot – Future - Parity Rising future prices will – due to arbitrage trading - induce rising spot prices. For example, a future traded at 6,000 € is clearly overpriced, when the stock portfolio remains unchanged at 5,500 €. In this case, „smart“ traders will make arbitrage profits of 407,50 € per contract and bring back the market to equilibrium: Note, that the arbitrage profit equals the difference between a fair- and mispriced future (6,000 – 5,592,40) plus Dividends. Higher Future prices will lead to massivly increased demand at spot markets until spot prices and futures are back to equilibrium.
Spot – Future – ParityFinancial Market Stability • Spot Markets and Future (Forward) Markets are interlinked. • Mispriced spot or future market instruments will affect both markets • Future market speculations that drive futures prices will also drive spot market prices due to arbitrage trading (et vice versa) • Speculation on futures markets, resulting in higher future prices will induce higher spot market prices due to arbitrage trading. Finally this may result in spot market bubbles that jeopardizes the allocation mechanism of real goods markets.
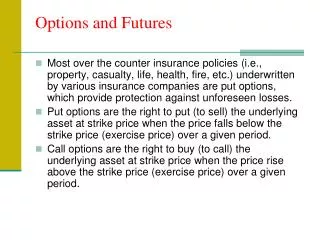
Options and other derivative securities have several important economic functions: • Help bring about a more efficient allocation of risk; • Save transactions costs…sometimes it is cheaper to trade a derivative than the asset underlying it, and • Permit investment strategies that would not otherwise be possible. Economic Benefits Provided by Options • Derivative securities are instruments that derive their value from the value of other assets. Derivatives include options, futures, and swaps.
Call option • Gives the holder the right to purchase an asset at a specified price on or before a certain date • Gives the holder the right to sell an asset at a specified price on or before a certain date Put option • American options allow holders to exercise at any point prior to expiration • European options allow holders to exercise only on the expiration date American or European option Options Vocabulary • Strike price or exercise price: the price specified for purchase or sale in an option contract
Long position • The buyer of an option has a long position, and has the right to exercise the option. • The seller (or writer) of an option has a short position, and must fulfill the contract if the buyer exercises. • As compensation, the seller receives the option premium. Short position Options Vocabulary • Neither trade usually has any connection to the underlying firm. • Can trade options on an exchange (such as CBOE) or in the over-the-counter market.
Moneyness of Options S = current stock price X = strike price
The priceper share for an option contract, which is a contract to buy or sell 100 shares of the underlying stock. • CBOE options expire on the third Saturday of the expiration month. Option quotations Opti-Tech Expires Strike Call Put 30.00 April 27.50 3.26 0.67 In-the-money callsOut-of-the-money puts 30.00 May 27.50 3.91 1.23 30.00 April 32.50 0.85 3.24 In-the-money putsOut-of-the-money calls 30.00 May 32.50 1.55 3.83 Option Quotations
For in the money options: the difference between the current price of the underlying asset and the strike price (S-X for calls and X-S for puts). • For out of the money options: the intrinsic value is zero. Intrinsic value Time value • The difference between an option’s intrinsic value and its market price (premium) • Consider the May call with $27.50 strike price from previous table: • Intrinsic value = $30.00 - $27.50 = $2.50 • Time value = $3.91 - $2.50 = $1.41 Intrinsic and TimeValue of Options
Long and short positions Use payoff diagrams for: Gross and net positions (the net positions subtract the option premium) Payoff Diagrams • Shows value of an option on the expiration date • Y-axis plots exercise value or “intrinsic value” • X-axis plots price of underlying asset Payoff: the price of the option at expiration date
Payoff Payoff at Expiration slope = 1 75 83 stock price -8 Net payoff Long Call Option Payoffs x = $75, premium = $8
Short Call Option Payoffs 75 83 x = $75, premium = $8 +8 stock price • Both long and short positions have zero net payoff at a price of $83 • On net basis, buyer of the call makes a profit when the price exceeds $ 83; seller of the call makes a profit when price is below $83. Payoff Payoff at expiration Net payoff slope = -1
75 68 Payoff Payoff at expiration Price of stock 68 75 -7 Net payoff Long Put Option Payoffs x = 75, premium = $7
Net payoff 7 75 68 Stock price Payoff at expiration Payoff -75 Short Put Option Payoffs x = 75, premium = $7
Portfolios of Options Look at payoff diagrams for combinations of options rather than just one Shows the range of potential strategies made possible by options Some positions can be a form of portfolio insurance. Some strategies allow investor to speculate on the volatility (or lack thereof) of a stock rather than betting on which direction it will move.
Payoff Net payoff 30 38 22 -8 Portfolio Containing 1 Call and 1 Put (Long Straddle) Call x = 30, premium = $4.5, Put x = 30, premium = $3.5 • Buy a put and a call on the same stock at the same strike price and the same expiration date • Profits come with large price changes in either direction. • Positive net payoff if the price rises above $38 or falls below $22
Strangle Position Value Share Price Option Strategies (Strangle) Strangle - Long call and long put (at different exercise prices) Strategy for profiting from high volatility
Long Call Short Put Position Value Share Price Exercise Price (Strike) Option StrategiesSynthetic Long Future Synthetic Long Future(Long Call & Short Put)
Option StrategiesSynthetic Short Future Short Call Share Price Position Value Long Put Exercise Price (Strike) Synthetic Short Future(Short Call & Long Put)
Option Strategies (Short Butterfly)
Construct portfolios that include options, stocks and bonds: Bond and call options Stock and put options Other Option Portfolio Payoffs Now look at portfolios containing options, stocks, and bonds: • Looking at these payoffs will help lead us to an important option pricing relationship: put-call parity.
$X = strike price of put x Payoff at expiration x Stock price Gross Payoff of Stock + Put • Position allows investor to profit if stock price rises above $X. • If stock price falls below $X, portfolio provides protection: put option allows investor to sell at a price no lower than $X.
Gross Payoff of Bond + Call • The bond assures a minimum payoff of $X • The call allows for a higher payoff if the stock price rises $X = strike price of call and face value of bond x Payoff at expiration x stock price This payoff diagram and the preceding one are identical!
Future payoffs of “stock+put” are identical to payoffs of “bond+call” provided: • Put and call have same exercise price and expiration date; • Underlying stock pays no dividends during life of options; • Put and call are European options; • Bond is risk-free, zero-coupon, price at maturity = strike (X), • Bond matures when options expire. Put-Call Parity Price of put + price of stock = Price of call + price of bondP + S = C + B • If two assets A and B, have same future payoffs with certainty, then they should sell for the same price now
Price of underlying asset • Asset price and call price are positively related. • Asset price and put price are negatively related. Time to expiration • More time usually makes options more valuable. Strike price • Higher X means higher put price; lower X means higher call price. Interest rate • Calls: higher rate means higher call value. • Puts: higher rate reduces put value. Factors Affecting Option Prices(holding other factors equal)
1 year Stock – price t0: 150 € Stock – price t1: 150 € = 120 X 2,7184 – 0,10 Strike Call t0 (PV): 108,58 € Strike Call t1: 120 € Evaluation Framework Assume that a stock is currently quoted at 150 €. If nothing happens over the coming year, the stock‘s price will also be at 150 € in one year. The one-year risk free rate is at 10%. Under this assumptions, a Call – Option, maturing one year from now with a strike of 120 € is easy to value: The Intrinsic Value of the Call (X-S) is 41,42 € !!
Evaluation Framework Under this conditions, the Call Option Pricing Model is like: This price is a fair price, as it does not allow to gain risk-free profits from arbitrage-trading: One could also borrow money to buy the stock now. At a risk free rate of 10% p.a. the cost of borrowing over one year will add to ((150€ x (2,7184 0,10) - 1)) 15.7764 €. The other way round – borrowing money to buy the option - and one year later the stock leads to the same borrowing costs: Borrowing of 41,42 € at 10% means to pay back 41,42 x 2,7184 0,10 = 45,7764 € after one year. Netted with the profit from the option‘s exercise at a strike of 120 € (150 € - 120 € = 30 €), the costs add to 15.7764 €.
Price & Value Chart Option PriceIntrinsic ValueTime Value Intrinsic Value Option Price Time Value Premium Stock Price Strike Out of the money at the money in the money „Greeks“ show the sensitivity of the option price referring to: D = Delta:Call Price and Spot Price G = Gamma:Delta = Theta:Call Price and Time to Expiration K = Kappa / Vega:Call Price and Volatility R = Rho:Call Price and Int. Rate
Suppose a stock now worth $40 might increase or decrease in value by $10: Call option with X = $40 will pay $10 or $0. Now suppose a stock worth $40 might increase or decrease in value by $20: Call option with X = $40 will pay $20 or $0. Factors Affecting Option PricesVolatility The 2nd call option is more valuable…upside is better, downside the same as the 1st option.