Exporting E-scrap:
Exporting E-scrap:. Do we have a choice?. FACTS. everybody is aware of the volume of e-scrap generated….. approx. 250M computers will be discarded in 2007-2008 worldwide according to the UNEP – the world generates 20 to 50M tons of e-scrap per year

Exporting E-scrap:
E N D
Presentation Transcript
Exporting E-scrap: Do we have a choice?
FACTS everybody is aware of the volume of e-scrap generated….. • approx. 250M computers will be discarded in 2007-2008 worldwide • according to the UNEP – the world generates 20 to 50M tons of e-scrap per year • according to the U.S. EPA, an estimated 30 to 40 million PCs will be ready for "end-of-life management" in each of the next few years. • the volume of unused electronic gear that sits in storage is about 180 million TVs, desktop PCs, and other components as of 2005, according to the EPA
FACTS e-scrap generation… • digital HDTV broadcasts are scheduled to be completed by 2009, rendering inoperable TVs that function perfectly today • Moore’s Law - computer processing power roughly doubles every two years, thus at any given time, all the machines considered state-of-the-art are simultaneously on the verge of obsolescence • EPA estimates that in 2005, between 1.5 and 1.9 million tons of computers, TVs, VCRs, monitors, cell phones, and other equipment were discarded • 200 million TVs will be discarded between 2003 and 2010 • 9% - annual growth rate of worldwide market for e-scrap
FACTS …..e-scrap ends up……. • In the US, 70 percent of discarded computers and monitors, and well over 80 percent of TVs, eventually end up in landfills • discarded electronics account for approximately 70% of heavy metals and 40% of the lead found in U.S. landfills according to a 2001 EPA report • In 2005, less than 20 percent of e-waste entering the solid waste stream was recycled Bob Tonetti, EPA • between 2-4 million tons of e-waste from the US end up overseas for low tech recycling each year
FACTS …e-scrap ends up…. • e-scrap are exported under the guise of reuse in developing countries – ¾ actually non-working • exports have shifted to African countries, India, Pakistan and Southeast Asia after China became restrictive …and this leads to… • in China, air near some e-scrap processing operations that remain open contain the highest amounts of dioxin measured anywhere in the world • elevated blood lead levels of children in Guiyu, an electronic waste recycling town in China
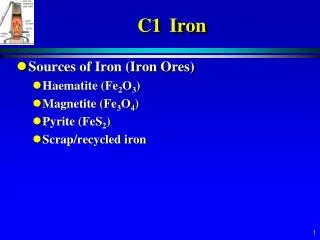
FACTS resource consumption in e-scrap • 36% of copper produced in the world goes to electrical and electronic equipment (German Metal Industry Association estimate in 2007) • Only 12% of total copper production comes from recycled copper (EU – 23%) 2005 data • Metals in Printed circuit boards contain 10X the concentration of precious metals from content-rich minerals • 28% - metal content of printed circuit boards –copper, lead and tin (Shanghai Jiao Tong University’s School of Environmental Science and Engineering) • Average copper content of ore is 0.6% in 1995, down from 3.6% in 1905 (US Bureau of mines)
FACTS • 90% of the average desktop is made of reclaimable copper, aluminum, iron, steel, and plastics • copper comprises 3% of television sets and 12% steel • recycling gold from old computer motherboards is far more efficient and less environmentally destructive than ripping it from the earth, often by surface-mining that imperils pristine rain forests -High Tech Trash, Nick Carroll, 2007 • approximately 20 percent of CRTs are comprised of lead, equivalent to between four and eight pounds per unit
Metal Consumption(PCs and Cellphones) Metal Consumption Production PCs and Laptops Cellphones % to Annual Metal (tons/year) 230M Units 1000M Units Production Ag 20,000 1000mg/unit =230MT 250mg/unit =250MT 2% Au 2,500 200mg/unit = 46MT 24mg/unit = 24MT 3% Pd 215 80mg/unit = 18MT 9mg/unit = 9MT 13% Cu 15,000,000 500g/unit = 115,000MT 9g/unit = 9,000MT 1%
Reality …with all these facts we also know…. • software upgrades, new devices and technological advancements will continue - more raw materials will be consumed - more e-scrap will be generated • e-scrap trade will continue • as some countries become restrictive, new markets will open due to economics • these new markets will employ primitive processes exposing people and the environment to toxic materials
What Goes Around Comes Around "The U.S. right now is shipping large quantities of leaded materials to China, and China is the world's major manufacturing center," Jeffrey Weidenhamer (a chemist at Ashland University) says. "It's not all that surprising things are coming full circle and now we're getting contaminated products back.“ – after analyzing China-made cheap jewelry bought from a dollar store
our dilemmas are……. • avoiding pollution (or avoiding the export of pollution) • resource conservation
The 2 concerns are intertwined Resource conservation – through recycling, less minerals mined and oil extracted But – constrained because of the fear of exporting pollution to developing countries
CHALLENGES • the recycling of all materials back into nature or the marketplace in a manner that protects human health and the environment. (zero waste) • reducing our carbon footprint in the manufacture of products
E-SCRAP MECHANICAL PROCESS Sort Pull Components (Toxic or High Value) Ferrous (Magnetic) Shred & Magnetic Separation Resale Non-magnetic Aluminum/ Non-ferrous Precious Metal Recovery Sort/Separation Resale Plastics Landfill
DESKTOP DISASSEMBLY TREE Desktop Computer 12kgs Product 32 mins. Power Supply 1.20kgs CD Rom 0.50kg Floppy Drive 0.50kg Hard Drive 0.50kg Hi-Grade PWB 0.90kg Wires/Cables 0.90kg Component Chips/ICs Memory Chips Processor Steel Scrap 7.0kgs Plastic 0.50kg Material Labor cost to disassemble – US$0.37
HARD DRIVE DISASSEMBLY TREE Hard Drive 0.50kgs 10 mins. Component Hi Grade PWB 0.05kg Mixed Material 0.13kg Head Stock Assy (acctd in mixed matl) Au/Steel Mix 0.08kg Magnets 0.08kgs Aluminum 0.15kg Scrap 0.01kg Material Labor cost to disassemble – US$0.12
FLOPPY DRIVE DISASSEMBLY TREE Floppy Drive 0.50kgs 5 mins. Component Low Grade PWB 0.17kg Tap 0.02kg Copper Coil 0.03 Steel 0.16kgs Aluminum 0.10kg Plastic 0.01kg Scrap 0.01kg Material Labor cost to disassemble – US$0.06
POWER SUPPLY DISASSEMBLY TREE Power Supply 1.2kgs 5 mins. Component Wires 0.16kg Low Grade PWB 0.44kg 3 mins. Copper Ring 0.10kgs Transformer 0.05kg Stripped Low Grade PWB 0.25kg Steel 0.60kgs Aluminum Heatsink 0.04kg Material Labor cost to disassemble – US$0.06
CRT DISASSEMBLY TREE Monitor 12kgs Product 37 mins. 3 mins. 12 mins. 1 min. Wires/Cables 0.46kg Low Grade PWB 1.30kgs Deflection Coil 0.58kg Thick Wire 0.10kg CRT Screen Complete 8.50kgs Transformer 0.05kg Low Grade PWB Stripped 1.20kgs Electron Gun, Getterpil, CRT Glass 0.03kg 5 mins. Component 4 mins. Electron Gun 0.027kg Getterpil 0.003kg Plastic Casing 1.90kgs Aluminum Heatsink 0.23kg Mixed Scrap 0.35kg Wire/Copper 0.41kg CRT Glass 8.47kgs Material Mixed Metals 1.00kg Labor cost to disassemble – US$0.43
PRINTER DISASSEMBLY TREE Printer 6.53kgs Product 38 mins. Toner Cartridge 0.07kg Mixed Wiring 0.20kg Hi Grade PWB 0.66kgs Steel/Plastic Mix 3.00kg Component Steel 1.30kgs Plastic 1.30kgs Material Labor cost to disassemble – US$0.44
MANUAL PRE-PROCESSING In a study conducted in 2007 by a student of the Swiss Federal Institute of Technology - strength of the Chinese e-scrap recycling system is the efficient manual preprocessing that results to a high material recovery rate • primitive and hazardous processes are employed during actual recovery of complex materials • study shows that recycling percentages increase from 70% to 84% when the complete manual-dismantling scenario is compared with shredding • partial dismantling of the desktop PC into its main sub assemblies such as drivers, main boards and casing shows the recycling rate of 79% • study concludes that high level manual dismantling is economically and environmentally preferable to a mechanical pre-processing under Chinese settings • but, best available technology (BAT) should be employed in recovery of materials
Collection Sorting/ Segregation Mechanical Processing Smelting/ Refining Mechanical Processing Collection Sorting/ Segregation Manual Pre- Processing Mechanical Processing Smelting/ Refining Manual pre-processing Optimal Process for e-scrap Recovery 70% Recovery 79-84%
Economic Benefits Material Revenue - Whole PCs Mechanical Manual kgs Process Disassembly Desktop PC (shredded) 12.0 US$4.00 Power Supply 1.3 US$0.65 CD Rom 0.5 0.07 Floppy Disk 0.5 0.07 Hard Drive 0,5 0.40 Hi Grade PCB 0.9 4.50 Wires/Cables 0.9 1.62 Steel Case 7.0 1.89 Plastic 0.5 0.10 Total US$4.00 US$9.30
Resource Conservation Recovery from 30million PCs Mechanical Manual Process Disassembly Plastics 0 15,000 tons Recovery of metals 231,000 tons 260,000 tons (70%-79%) Total Incremental Materials Recovered 44,000 tons Assuming 20% of incremental metal is copper Copper not needing to be mined 5,800 tons At today’s value US$ 40.6M At mine yields of 0.6%, this is equiv to ore 967,000 tons
Resource Conservation Recovery from 30million CRTs Manual Disassembly Recovered Materials Copper 18,000 tons Lead 81,000 tons Silver 168 tons Gold 12 tons Palladium 6 tons Total Materials Recovered 99,186 tons Approximate Value US$224M
Physical Infrastructure • Basic requirements for manual pre-processing • space – 1.5X cheaper • labor – 14X to15X cheaper • tools – readily available
Legal Framework • US EPA does not classify e-scrap as hazardous thus exportation not controlled • most Asian countries restrict imports • some countries require notification • some countries allow importation for recovery (Thailand, Philippines, Singapore) • importation generally allowed for reuse • China disallows imports but misdeclaration is rampant • though laws are in place, loopholes still abound due to weak enforcement and corruption
Export vs Domestic Processing Export (pros) • resource conservation • recovery of plastics • more metals recovered • low value metals may be recovered • opportunity for employment • cleaner fractions • less processing costs • economic benefits for exporter and processor • flush out stored e-scrap
Export vs Domestic Processing Export (pros) • encourages reuse of components • diminished demand for new products and their commensurate requirement for virgin raw materials • less use of water and electricity for manufacturing new products • less packaging per unit • availability of technology to wider swaths of society • diminished use of landfills • minimized leaching of toxic substances
Export vs Domestic Processing Export (cons) • improper, primitive processes • contamination of the environment • exposure of people and communities to toxic and hazardous materials • safety issues • exploitation of workforce • additional costs • labor • freight/transport • difficulty of control/monitor • longer leadtimes • contaminated products get to the US domestic market • legal restrictions/bureaucracy
Export vs Domestic Processing Domestic (pros) • quicker turn-around • ease of monitoring and control • less potential liability • lesser environmental risks • safer and healthier processes • less chances of contaminated products entering the domestic market • peace of mind
Export vs Domestic Processing Domestic (cons) • values are not maximized • higher processing costs at smelters • lesser materials are recovered • plastics – practically nil • will not maximize resource conservation • zero-waste can never be achieved • with minimal economic benefits, stored e-scrap will be difficult to flush out • more e-scrap end up in landfills
CONCLUSION • Do we really have a choice? No. We have to do something to be able to recover more metals and plastics from e-scrap. • There is no other way but to include in the recovery equation manual pre-processing • There are no other places to do this but in developing nations where labor is cheap • Metal recovery may be done in Europe, Japan or Korea (developed nations)
CONCLUSION HOW???? • government to government initiatives • If manufacturers can set up in Asia and other developing nations, why can’t recyclers? • Exporters should be aware of the processes employed by those receiving their e-scrap • no compromise between health and safety of workers and maximizing recovery of materials • more studies need to be conducted on maximizing recovery and reducing environmental impact of recycling activities • call to action • accredit/audit qualified overseas recycler? • anything as long as pollution is not exported and resources are conserved
www.iri.com.ph Thank you and have a nice day!!