Download
1 / 30
300 likes | 507 Vues
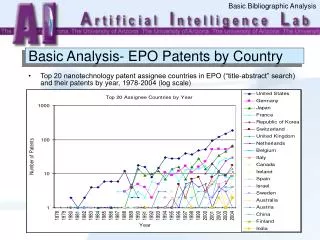
Papers, Patents and … . Products. Jack Brittain, PhD Pierre Lassonde Presidential Chair Vice President, Technology Ventures University of Utah http://www.techventures.utah.edu/. Utah Transformed Operation. 4 Years Later. 2004 “Technology Prevention Organization”

E N D
Papers, Patents and … Products Jack Brittain, PhD Pierre Lassonde Presidential Chair Vice President, Technology Ventures University of Utah http://www.techventures.utah.edu/
Utah Transformed Operation 4 Years Later • 2004 “Technology Prevention Organization” • Throwing technologies over the wall “hoping the coyotes will raise them” • Bottom half of TTOs, ranked 96th 2008 Sugar Bowl Trophy • 2008 Tied MIT #1 (2009 #1) in number of spinoffs based on University technology • Top 10 ranked office NSF study • FY 2006 to present: • 1,117 disclosures • 306 new inventors • 207 issued patents • 376 executed agreements • 124 start-up companies • over $170 million licensing and royalty revenues • over $250 million commercial-sponsored research Fortress Ruins
Economic Significance “The economic significance of the research university goes far beyond its role of education and training. For several decades, university research has increasingly formed the foundation of significant technological advancements. These technologies enter the marketplace through research collaborations with industry, licenses, and to an increasing extent, university-driven efforts to turn new ideas into start-up companies.” Jan Crispin, Senior Research Economist. The Economic Impact of Startup Companies and Invention Licensees Originating from Research at the University of Utah.Bureau of Economic and Business Research, 2011.
Technology Value Curve Spinoff ValueGeneration Services • Prototype • Incorporation • Logo/website • Corporate Secretary • CFO Solutions • Umbrella Insurance • Market research • Grants programs Where Universities Traditionally Add Value IDEA PROOF OF CONCEPT PROTOTYPE COMMERCIAL LAUNCH MARKET EXPANSION Commercialization Stage
Utah Spinoff Development 31Technologiesin Pipeline(0 counted startups) 162Operating Companies7,186 Utah Employees Over $39 million Commercialization Grants (2005-11)over $300 million Start-up Investments (2005-11)(203 Start-ups 1970-2011) SpinoffValueGeneration IDEA PROOF OF CONCEPT PROTOTYPE COMMERCIAL LAUNCH MARKET EXPANSION Commercialization Stage
Spinoff Development Spinoff Value Generation • Phase 1Formation • Legal Formation • Technology License • Product Development • Logo, web • Product development grants • Phase 2Business • Business Plan • Product Validation • Product development grants • Angel & Seed Investors • Phase 3Operating • Customers Testing Product • Investors • Key Managers • Board of Directors • Bank Credit • Phase 4MarketEntry • Marketing/Sales • StrategicPartnerships • New Products &IP in development Phase 5Long TermGrowth COMMERCIAL LAUNCH MARKET EXPANSION PROTOTYPE Commercialization Stage
Spinoff Results 2011 Spinoff Value Generation Phase 1Formation 27Companies $755,000Grants $800,000 Investments17Employees Phase 2Business 23Companies $4,430,000Grants $5,480,000 Investments51Employees Phase 3Operating 22Companies $12,832,000Grants $78,015,000 Investments153Employees Phase 4MarketEntry 18Companies $8,137,000Grants $11,920,000 Investments131Employees Phase 5Long TermGrowth 72Companies $13,200,000Grants $185,307,000 Investments6,4150Employees COMMERCIAL LAUNCH MARKET EXPANSION PROTOTYPE Commercialization Stage
Spinoff Partnerships Spinoff Value Generation Phase 1Formation 27Companies $755,000Grants $800,000 Investments17Employees Phase 2Business 23Companies $4,430,000Grants $5,480,000 Investments51Employees • USTAR Medical Devices Accelerator • Venture Bench Accelerator • Software Development Center Accelerator • DOE Renewable Energy Commercialization Center Phase 3Operating 22Companies $12,832,000Grants $78,015,000 Investments153Employees Phase 4MarketEntry 18Companies $8,137,000Grants $11,920,000 Investments131Employees Phase 5Long TermGrowth 72Companies $13,200,000Grants $185,307,000 Investments6,4150 Employees UURFIncubator COMMERCIAL LAUNCH MARKET EXPANSION PROTOTYPE Commercialization Stage
Accelerators • Spanning Valley of Death • The Gully of Inconvenience • Leverages investor dollars • Community engagement • Student Opportunities: Pole Vault Media • Entrepreneurs In Residence • Commercialization Advisory Board/Company Collaborations
Tech Ventures Team >$100 million • Seed Funds • KickStart • UpStart • Lineagen • Vendice • Navigen • 7 Revs • UVF Glenn PrestwichPresidential ProfessorPresidential Special Assistant Entrepreneurial Faculty Assoc Community of Faculty Entrepreneurs Ron Weiss, MDretired ARUP CEO Faculty Outreach 5-8 faculty case load 280 faculty10% total faculty Doug Lloyd/David Dolan Serial Entrepreneurs Entrepreneur in Residence Troy D’AmbrosioSeasoned Entrepreneur Raised Capital Director of Education Programs > 100 business people > 1700 students Zach Miles, Interim Director and Associate Director 25 fulltime professionals + 30 student interns Technology Commercialization/Commercial Research Research $250 millionfederal research 250 “Inventions” 70 Potential Licenses30 Potential Companies Commercialization Company
Disclosures CalTech MIT Number of Disclosures Millions of Federal Research Dollars
Changes Changed from cost recovery to investment model Cost recovery is inevitably a failure Investment logic produced tangible economic impact Changed the nature of our work to the positive Total Mission Integration Integrated student programs enhance University, engage faculty Commercial sponsored research gave us a sustainable business model Programs mitigate early stage risk Provide leverage for investors Encouraged capital formation
Universities and theInnovation Ecosystem “Universities do not get enough credit for the fact that as players in our innovation ecosystem, they’re willing to gamble on cash-strapped startups. At the end of the day, who else is offering to pick up the tab? … Warts and all, universities remain willing to pay patent costs to support expensive and increasingly sophisticated IP strategies for startups who will likely never be able to pay them back.” - Melba Kurman, Triple Helix Blog, 25 Feb 2011
Research and Innovation Dr. Geoffrey Nicholsoninventor of the Post-It™: “Research is the transformation of money into knowledge. Innovation is the transformation of knowledge into money.” As innovators, universities are unique in their dedication to reinvesting innovation returns in knowledge creation.
Total Mission Integration • Educational programs > 1700 students • Defining educational experience • Huge positive for faculty • Donor gifts over $25 million • LassondeCenter • Sorenson Discovery Center • Annual sponsorships over $1 million • University Venture Fund • manages $18.5 million in Fund I • Fund II target is $50 million
Enriches Research • Translation processgenerates questions • Creates new fundingopportunities • Commercial sponsors tendto be repeat customers • Less grant writing is more timefor research • Work with faculty whowant to be involved • Does not matter if faculty opt out • Faculty success generates interest
University Startups, Revenue and Equity Revenues Foundation Equity Start-ups
Utah Economic Impact ofUniversity of Utah Research [1] Bureau of Economic and Business Research, 2010 and 2011. Includes direct, indirect, and induced employment. [2] State and local taxes.
Western InnovationNetwork Full Network Founding Members
WIN is about collaboration NSF funded Partnership for Innovation (PFI) grant to explore universities collaboration model to enhance commercialization University research yields 1 start-up per $93 million in funding U.S. spent nearly $60 billion 644 new companies Can we do better? Energy CommercializationCenter (ECC) is related DOE grant Includes National Labs
What if U.S. was doing as well? Utah: • 1 Spinoff per $12 million in federal research U.S. potential results: • 1 spinoff per $25 million in federal research= 1,800 spinoffs • $18 billion other federal research programs= 1,120 spinoffs • 2 spinoffs for 3,600 non-research institutions= 7,200 spinoffs • Over 10,000 spinoffs per year • After 5 years, over 5 million jobs
WIN Programs Shared researchresources improve utilization support commercialresearch Commercialization bestpractices Pooled IP assets Commercialization service for non-research colleges Regionalize deal flow Connect start-ups & seed capital funds Improve matching with human capital
Western InnovationNetwork Full Network
Done right,commercialization program … Enhances faculty research Defining educational opportunities for students Positive community contributions and partnerships Winning Together, Oklahoma Marathon