
UK S&OP + Process
UK S&OP + Process. Kirstie Edwards November 2011. UK S&OP+. 5 Levels of S&OP Maturity Level Definitions UK Timelines. 5 S&OP+ Process Steps Process definition & Period cycle Step by Step Purpose & UK Inputs & Outputs. Benefits of S&OP+ Why transition from S&OP

UK S&OP + Process
E N D
Presentation Transcript
UK S&OP + Process Kirstie Edwards November 2011
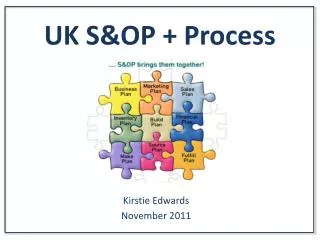
UK S&OP+ • 5 Levels of S&OP Maturity • Level Definitions • UK Timelines • 5 S&OP+ Process Steps • Process definition & Period cycle • Step by Step • Purpose & UK Inputs & Outputs • Benefits of S&OP+ • Why transition from S&OP • Impact of Forecast Accuracy
S&OP+ Maturity Levels LEVEL 1 • Definition: LEVEL 1 • Management meetings are traditional in construction, with primary focus firmly on the past to analyse what has already happened. • -There is an annual budgeting process with little focus on forward projections and strategy, but deliver a detailed short term view by line. • -Functions tend to work in silos with few aligned objectives and measures across divisions. • -Functional behaviours are defensive, rather than collaborative UK Timeline Day 1. S&OP processes do not exist February 2010
S&OP+ Maturity Levels LEVEL 2 • Definition: LEVEL 2 • -Process elements are defined with correct accountability across divisions and KPIs • -Correct S&OP structure is in place, with reporting relationships and objectives set. • -Focus is Demand / Supply tactical balancing • -Divisional behaviours are challenged, but not yet performing as aligned team • -Integrated Supply Chain KPIs are initiated UK Timeline Eg. Demand forecasting volumes with poor accuracy May 2010 Day 1. S&OP processes do not exist February 2010
S&OP+ Maturity Levels LEVEL 3 • Definition: LEVEL 3 • -The periodic cycle and processes are established and driving integrated Operational and Financial Planning • -A suite of KPIs covering Customer centricity; Supply chain management; Demand Forecasting and -Financial performance is used as a leading indicator, and showing operational effectiveness of 95%+ capability • -Issues are identified and this is the decision making process • -Annual budgeting is removed and S&OP numbers drive forward planning • -High Performing Team behaviours are demonstrated throughout the process IBP model built. NSV Pd forecasts & 2011 plan. Supply aligned to Demand July 2010 UK Timeline Eg. Demand forecasting volumes with poor accuracy May 2010 Day 1. S&OP processes do not exist February 2010
S&OP+ Maturity Levels LEVEL 4 • Definition: LEVEL 4 • -Rolling business management forecasting process including Gap analysis vs. strategy and focus on competitive priorities • -Integrated reconciliation is established and providing underlying understanding of business to drive improvement priorities and gap closing actions • -Used to deploy and drive value proposition • -Aligned to Program Summit to be catalyst for markets success in achieving financial shaping targets Portfolio reviews & Financial reconciliation embedded into UK S&OP. January 2011 IBP model built. NSV Pd forecasts & 2011 plan. Supply aligned to Demand July 2010 UK Timeline Eg. Demand forecasting volumes with poor accuracy May 2010 Day 1. S&OP processes do not exist February 2010
S&OP+ Maturity Levels LEVEL 5 • Definition: LEVEL 5 • -Continuous reconciliation, managing gaps and alternative scenario planning • -Drives responsive optimisation of the business in pursuit of strategy ‘Gaps’ managed & driving activities aligned to strategies. S&OP+ Part of UK culture May 2011 Portfolio reviews & Financial reconciliation embedded into UK S&OP. January 2011 IBP model built. NSV Pd forecasts & 2011 plan. Supply aligned to Demand July 2010 UK Timeline Eg. Demand forecasting volumes with poor accuracy May 2010 Day 1. S&OP processes do not exist February 2010
S&OP+ Input & Output Policies Strategy Financial Shape Sales & Operations Planning Demand Forecast Capacity Sales Plan Financial Forecast Operations Plan Sales periodically Channel / Product Year End Estimate & Plan Production periodically & Supplier planning Demand management NPD, promotions, specials GAP analysis Labour plans Including irregular hours & OT Customer Service Levels Inventory level management Program Summit – Financial Shaping The Inputs and Outputs are delivered through 5 Steps in a Periodic Process
The 5 Steps of S&OP+ Steps 1,2,3 = Foundation S&OP Steps 4,5 = Mature S&OP+ What are they ? The 5 S&OP+ process steps is completed in the UK each period (Steps 1to3 foundation S&OP and Steps 4to5 mature S&OP+). The process is governed by the S&OP manager, and steps occur at set times during the period cycle. The following section provides further detail of these process steps as currently delivered in the UK, laid out in a 4 week period cycle.
The 5 Steps of S&OP+ STEP 1 – DEMAND REVIEWS • Purpose • Manage performance of Markets/Brands/Channels/Accounts (value and volume). Develop long term unconstrained demand plan based on Marketing and Sales assumptions. Review deep dives on specific topics. • Outputs from the Demand review include: • Agreed long term unconstrained demand plan • Provide clarity around Sales Performance; Review & forecast Sales Trends • Agreed resources to fulfil demand plan • Risks & opportunities, identified gaps, defined action plans • Escalations/replies to other reviews • Measure forecast accuracy & leverage for improved Sales Performance. Samples: KPIs and Performance results. Gap Analysis and Forecast Assumptions • We analyse S&OP forecast accuracy, performance and assumptions of volumes and NSV by channel, holding Channel managers accountable for the delivery of forecast and Business Plans. • For Single Serve we measure forecast accuracy of volume and value by Partner • Impact of variances to forecast on the rest of the business is clear and ownership taken in Demand. • We review the latest assumptions driving the forecast for this year and next year • We compare the current YEE to official Plan • We compare the current YEE to the rolling forecast for next year. As part of Program Summit, in 2012 the S&OP forecast YEE will be measured vs LY and Next Yr. (see example slide 14) • Gaps are indentified and actioned • P9 & 10 Kafevend Volume phasing only • C400 YTD actual sales 4075 • C400 YTD forecast accuracy avg (3 pd fixed measure) = 99% • C400 YTD impact on inventory = 43 brewers • Current inventory levels = 600 brewers (6 wks stock)
The 5 Steps of S&OP+ STEP 1 – DEMAND REVIEWS Examples By channel understand assumptions behind volumes and measure performance for overall business impact. Eg New Business machine placements vs Repeat account placements. Monitor CSV volumes for CAB input Klix NSV actuals, vs Plan and latest S&OP forecast. Review phasing and identify ‘gaps’ • Review Single Serve Partners performance vs S&OP forecast: Period; YTD and Full Year S&OP YEE • Drinks Volumes • Machine Volumes • NSV Review projected ASPs and Drinks Per Week for Year end vs last yr (growth/decline) Reviewed projected assumptions for next years ASPs and DPW vs latest YEE (growth/decline)
The 5 Steps of S&OP+ STEP 2 – SUPPLY REVIEWS • Purpose • Develop an achievable Supply Plan as a formal response to unconstrained demand plan from DMR. Manage supply chain performance, capability, flexibility, resources, supply financials & alternative supply scenarios. Review deep dives on specific topics. • Outputs from Supply review include: • Agreed supply plan • Agreed resources to fulfil supply plan • Recommended supply alternatives to meet demand plan • Recommendations/decisions on CAB spend • Risks & opportunities, identified gaps, defined action plans • Escalations/replies to other reviews Samples: KPIs and Performance results. Planning capacity; production; resource; purchasing; inventory • We review the latest Demand forecasts and account impacts with Supply leadership teams. • We analyse projected inventory levels vs target using latest Demand forecasts and build rates. • We agree production build rates to manage factory efficiency, minimising the number of line rate changes whilst balancing the needs of S&F. • We align forecast demands to capacity planning eg S&OP was enabler for shift operation change from 4 to 3 in January 2011, saving $0.5m pa • We review the Demand forecast accuracy levels by SKU to manage raws purchasing and Commercial prime cost impacts. • Expecting Period 13 FG inventory to close on target at 125 machines • 2012 inventory forecast currently reflecting flat build rate of 101 machines per week • Without factory line changes, inventory will peak in summer, and rely on Period 13 factory close to meet year end target. • No recommended changes to target inventory for 2012
The 5 Steps of S&OP+ STEP 3 – ACTIVITY REVIEWS • Purpose • Manage current portfolio - portfolio health/lifecycle management at SKU/brand/category level in line with business strategy & agreed targets. Manage future portfolio (innovation funnel)in line with business strategy/OGSM (with 3 year rolling horizon, balanced to resources, prioritized, delivered on time and in full via robust stage gate process and efficient project management) • Output from Portfolio Reviews include: • Decisions/recommendations on current portfolio rationalisation • Decisions/recommendations on future portfolio/innovation funnel • Activities prioritisation, Stagegate decisions • Risks & opportunities, identified gaps, defined action plans • Escalations/replies to other reviews • Activity benefits (volume & value) for integration to S&OP forecasting Samples: Activity and Portfolio projects impacting UK earnings – Consolidated reporting for UKLT • S&OP manager in alignment with Global Activity Managers & Local management teams (Demand & Supply) gathers all relevant data on projects will impact UK volumes and/or earning. • Eg New Launches, Promos, De-listing, change in customer trends, Pricing • Includes latest status; anticipated delivery dates and projected benefits of volume and NSV. • We also gather insights on forthcoming projects not yet resourced. • Outputs are reviewed by the UKLT to manage and prioritise resources • Project benefits are aligned with Global S&F & built into the S&OP forecasting model. • Volumes impacts are shared from S&OP with Supply for production, down to SKU level • There are currently 45 projects impacting UK earnings and volumes in 2011 • 11 have been completed and 5 stopped. • A further 29 projects are active, of which 3 are at High Risk of not delivering the reported benefits
The 5 Steps of S&OP+ STEP 3 – ACTIVITY REVIEWS Examples UK Leadership Team Periodic Activity Review – Executive Summary • Published periodically from S&OP to the UKLT • Covers all projects and activities Global and/or Local • Summarises any changes to status or benefits since last publication • Clearly shows all projects and highlights which ones are currently not included in S&OP forecast (eg in early feasibility phase) and therefore potential market upside to latest forecast • P11 includes leadership team review of the Gap Closing activities driven from the P10 S&OP review (section 2)
The 5 Steps of S&OP+ STEP 4 – FINANCIAL RECONCILIATION • Purpose • Prepare the Leadership Business Review agenda. Financialise the process outputs. Integrate and reconcile outputs, define gaps, prepare options/scenarios to close gaps, recommend decisions to the LBR. • Output from the Financial Reconciliation include: • Business Summary - Balanced Score Card, decisions made, escalations & decisions required, risks & opportunities, Additional supporting material • Options/scenarios and recommended decisions to close gaps Samples: Fully Integrated Planning enables translation of S&OP volumes in NSV and tracking of forecasts • The Financial reconciliation is driven through the Integrated Planning model developed currently in the UK. • There is no separate activity to translate volumes into NSV, as this is built into the forecasting model. This enables the demand channel managers to be empowered for the complete ownership of their channel beyond volume • They take accountability for their channel P&L and understand the financial impact their decisions and performance makes. • The financial reconciliation is the preparation of UKLT S&OP review slide-deck. This includes tracking the key drivers of YEE movements by Brand/Channel/Partner • Since last period the YEE has declined by £420k (Klix -£380, SS -£60)
The 5 Steps of S&OP+ STEP 4 – FINANCIAL RECONCILIATION • By channel we measure the NSV variances of S&OP YEE vs Plan. • We can easily review where the causes of these variances are , and where to focus any Gap closing activities: • Machine placements • Base Losses (Churn or Account losses such as Sainsburys) • Machines ASP • Drinks Volumes (DPW if not in machines base) • Drinks ASP • Revenue through ancillaries or other Services • Each period the latest YEE is measured against the rolling forecast for next year, by channel. • This replaces Plan and supports Program Summit • These summary tables are generated in the IBP model for Klix and SS
The 5 Steps of S&OP+ STEP 5 – LEADERSHIP TEAM REVIEW • Purpose • Review strategy deployment progress (incl. financial shape). Support or challenge key recommendations. Review & calibrate business delivery targets. Push decisions and actions back to the process management forums. Review deep dives on specific topics. • Outputs from Leadership Team review include: • Summary pack to all process management forums, and the whole organization • Key decisions on gaps & opportunities • Demand / supply trade-offs, new product master plan / resource trade-offs, business unit demand sign-off, financial framework actions, KPIs and Performance results across business. Forecast Assumptions. Risks & Opportunities. Gap Analysis • An S&OP period review takes place with the UKLT on Tuesday week 2. • S&OP publishes a 30+ slide-deck detailing the current performance; risks and opportunities and projected performance for the whole business • Clear actions are assigned to UKLT members and measured on closure of actions. • The slide-deck includes HOT TOPICS: being the burning issues as decided by the S&OP manager • HOT TOPICS only are presented by the S&OP to the UKLT • The supporting slide-deck (not presented) provides further analysis to support the HOT TOPICS. Each category has Customer centric KPI dashboards.
The 5 Steps of S&OP+ STEP 5 – LEADERSHIP TEAM REVIEW “2011 NSV YEE vs 2010 showing 4.7% YoY decline. Was -4.1% last period” “Klix drinks volumes 29mio cups less than 2010. Sainsburys stores a 22mio cup account lost end Q1, accounts for 16mio. A further 13mio cups down” Latest S&OP forecast showing UK 2.6% NSV growth in 2012 Drinks volumes YoY significantly different Klix decline 10mio cups vs SS growth 5.4mio packs. Machines volumes for Klix is showing growth + 166 machines, whilst SS machines growth of 57% includes C200 launch. Monitor Payplan YEE NSV growth / Cash Earnings Matrix Actions assigned to UKLT to deliver strategy UK stakeholders push back actions to their S&OP+ process review meetings. Actions aligned to market strategy and deliverables. Cash Earnings YEE 10%
Examples of Benefits of S&OP+ Susan L. Storch. Oliver Wight Americas. 2010