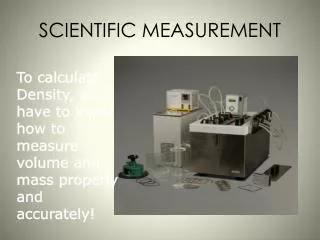
Scientific Measurement
Scientific notation simplifies the representation of large and small numbers by expressing them in a format that features a coefficient and a base in exponent form. This method is vital for precise calculations in scientific measurements, where accuracy and precision matter. Furthermore, the International System of Units (SI) establishes a standard for measurement that fosters collaboration among scientists globally. Key concepts also include limits of measurement, data presentation techniques such as line graphs, and the communication of scientific findings through peer review.

Scientific Measurement
E N D
Presentation Transcript
Scientific Notation • Very often in science it is sometimes necessary to use very large or very small numbers. • Writing out very long or small numbers can be quite cumbersome so an alternative called scientific notation is used. • Scientific notation divides a number into two parts, the coefficient and the base. • The coefficient must be greater than or equal to 1 and less than 10. • The base number is always written in exponent form
Scientific NotationExample • Light travels at approximately 300,000,000 meters per second • In scientific notation the speed of light is 3.0 x 10⁸m/s • In this example the coefficient is 3.0, while the base and exponent are 108. • The exponent 8 tells us that the decimal point should be 8 places to the right. • If the exponent is negative then the decimal point is to the left. • Eg. 0.000001 = 1 x 10⁻⁶
Scientific NotationMultiplication and Division • Multiplication: multiply the coefficients, add the exponents • E.g. (2.0 x 107) x (3.0 x 104) = (2.0 x 3.0) x 10(7+4) = 6.0 x 10¹¹ • Division: divide the coefficients and subtract the exponents • E.g. • (6.0 x 10¹¹) / (3.0 x 10⁴) = • (6.0/3.0) x 10(11-4) = • 2.0 x 10⁷ Assignment
SI Units of Measurement • (Systeme International d’Unites, France - 1791) • When scientists use the same units of measurement it is easier for them to collaborate and share their findings. • All SI standards are universally accepted and understood by scientists throughout the world
SI BASE Units The SI system is based upon seven base units:
DERIVED UNITS Additional units (derived) are formed from combinations of base units:
Prefixes Prefixes are used with the names of the units to indicate what multiple of ten should be used with the units.
Just an FYI:Map of countries still using imperial measurements Assignment
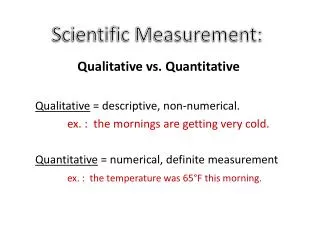
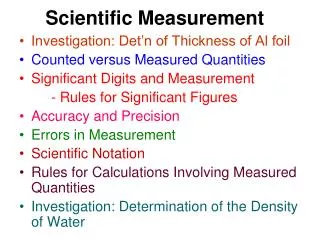
Limits of Measurement • Accuracy refers to the closeness of a measured value to a standard or known value. • Precision refers to the closeness of two or more measurements to each other.
Limits of Measurement • The precision of a calculation is limited by the least precise number used in the calculation. • Example 1: Density of object weighing 14.0g with a volume of 7.2752 cm^3 is 1.924345722 g/cm^3 • However since the least precise number has 3 significant figures, the answer is 1.92g/cm^3 • Example 2: Area of ground 12 meters by 4.52 meters is • 54.24 m^2, but since the least precise number in the calculation has 2 significant figures the answer is 54 m^2.
Measuring Temperature • Here we are used to the Fahrenheit scale for measuring temperature, and most are familiar with the Celsius scale. • The SI unit of temperature is Kelvin (K) • Conversions: • F = 9/5C + 32 • C = K + 273.15
Presenting Scientific Data • Organizing Data • Scientists can organize data by using data tables and graphs • Data tables relate variables, indicating the effect of one variable (manipulated) on another variable (responding).
Presenting Scientific Data - Line Graphs • Line graphs are useful to show the effects of changes in related variables. • The manipulated variable is represented by the horizontal or x-axis. • The responding variable is represented by the vertical or y-axis.
Presenting Scientific Data - Line Graphs • The data line represents a “best fit” plot of corresponding related variables. • The steepness or slopeof the line is the ratio of a vertical change to the corresponding horizontal change. • Slope = Rise / Run • Where “Rise” is the change in the y-variable and “Run” is the change in the x-variable
Presenting Scientific Data - Line Graphs • A direct proportion is one in which two variables are related such that the responding variable equals the independent variable multiplied by a constant. • An inverse proportion is one in which two variables are related such that the value of the responding variable equals a constant times the inverse of the independent variable.
Presenting Scientific Data – BAR Graphs • Good for comparing several sets of measurements.
Presenting Scientific Data – Circle Graphs • Good for determining how measurements compare to each other within the overall total. • Assignment
Communicating Data • Scientists communicate results by writing in scientific journals and speaking at conferences. • Peer review is a process by which scientists examine and check each others work. • Important to verify that results of scientific investigation are accurate and honest. • The sharing of scientific knowledge can lead to further understanding and insights by other scientists