
AtIAA1
AtIAA1. AtIAA2. SlIAA2. AtIAA33. AtIAA3. SlIAA33. SlIAA3. SlIAA35. SlIAA22. 86. AtIAA29. AtIAA4. 22. SlIAA29. 12. 48. SlIAA4. 18. 78. SlIAA36. SlIAA1. 74. 60. SlIAA23. AtIAA34. 90. 12. SlIAA21. 71. AtIAA32. 97. 56. 91. SlIAA8. SlIAA32. 99. AtIAA8. AtIAA30. 19.

AtIAA1
E N D
Presentation Transcript
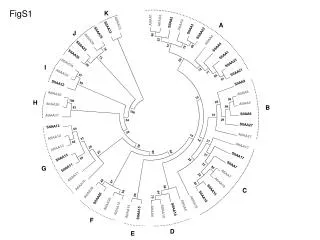
AtIAA1 AtIAA2 SlIAA2 AtIAA33 AtIAA3 SlIAA33 SlIAA3 SlIAA35 SlIAA22 86 AtIAA29 AtIAA4 22 SlIAA29 12 48 SlIAA4 18 78 SlIAA36 SlIAA1 74 60 SlIAA23 AtIAA34 90 12 SlIAA21 71 AtIAA32 97 56 91 SlIAA8 SlIAA32 99 AtIAA8 AtIAA30 19 58 100 28 AtIAA9 AtIAA20 66 83 100 SlIAA9 57 AtIAA31 29 54 SlIAA27 SlIAA12 64 38 AtIAA27 14 AtIAA12 33 14 21 86 AtIAA17 28 26 AtIAA13 94 23 29 37 SlIAA17 SlIAA13 59 28 22 SlIAA7 SlIAA11 80 AtIAA7 32 AtIAA11 48 97 AtIAA14 40 AtIAA10 56 SlIAA14 94 AtIAA28 44 80 SlIAA16 75 SlIAA26 AtIAA16 AtIAA26 AtIAA5 AtIAA18 SlIAA19 AtIAA15 AtIAA19 AtIAA6 SlIAA15 FigS1 K A J I H B G C F D E
Supplemental Figure S1.Evolutionary relationships of Arabidopsis and tomato Aux/IAA proteins. The evolutionary history was inferred using the Neighbor-Joining method (Saitou and Nei, 1987). The optimal tree with the sum of branch length = 7.80811039 is shown. The evolutionary distances were computed using the Poisson correction method (Zuckerkandl and Pauling, 1965) and are in the units of the number of amino acid substitutions per site. The analysis involved 54 amino acid sequences. All positions containing gaps and missing data were eliminated. There were a total of 68 positions in the final dataset. Evolutionary analyses were conducted in MEGA5 (Tamura et al., 2011).
2 8 12 IAA8 (1.65) (9.96) (57.41) (59.71) (64.34) (62.66) (64.37) (62.66) (65.67) (62.73) (63.15) IAA23 (51.42) IAA9 (59.33) IAA11 IAA16 (79.87) FigS2 1 3 4 5 6 7 9 10 11 IAA22 IAA21 (0.21) IAA32 (2.49) IAA35 (2.74) (3.07) (2.49) IAA17 IAA29 IAA33 (11.42) IAA7 (33.17) IAA4 (33.19) (37.76) IAA36 IAA12 (45.61) IAA2 IAA19 IAA3 IAA1 IAA15 IAA14 (63.95) IAA26 IAA13 IAA27 Supplemental Figure S2. Genomic distribution of Aux/IAA genes on tomato chromosomes. The arrows next to gene names show the direction of transcription. The number in parentheses designates the position of the ATG of each Aux/IAA gene in megabases (Mb) on tomato chromosome pseudomolecules (Tomato Whole Genome Scaffolds data V2.4). The chromosome numbers are indicated at the top of each bar.
A LxLxLx motif DLxLxLx motif B LxLxLxLxL motif FigS3
Supplemental Figure S3. Amino acid sequences for IAA proteinsthat contain an atypical domain I (A) Amino acid sequences for IAA proteins that contain an expanded repression domain I. Amino acid sequence comparison of tomato Sl-IAA11, Sl-IAA12 and Sl-IAA13 with those from Arabidopsis AtIAA10 (AT1G04100), AtIAA11 (AT4G28640), AtIAA12 (AT1G04550) and AtIAA13 (AT1G04550). The conserved LxLxLxLxLx motif is underlined. The sequences were aligned with Clustal X method and adjusted manually. (B)Amino acid sequences between conserved domains I and II for IAA proteins that contain a second LxLxL motif. Amino acid sequence comparison of tomato Sl-IAA7, Sl-IAA14, Sl-IAA16 and Sl-IAA17 with those from Arabidopsis AtIAA7 (AT3G23050), AtIAA14 (AT4G14550), AtIAA16 (AT3G04730) and AtIAA17 (AT1G04250). The conserved LxLxLx motif (Domain I) and the DLxLxL motif are underlined. The sequences were aligned with Clustal X method and adjusted manually.