Download
1 / 40
1.56k likes | 4.01k Vues
Chapter 16 One-way Analysis of Variance. Fundamental Statistics for the Behavioral Sciences, 5th edition David C. Howell. © 2003 Brooks/Cole Publishing Company/ITP . Major Points. An example The logic Calculations Unequal sample sizes Multiple comparisons Fisher’s LSD Bonferroni t.

E N D
Chapter 16 One-way Analysis of Variance Fundamental Statistics for the Behavioral Sciences, 5th edition David C. Howell ©2003 Brooks/Cole Publishing Company/ITP
Chapter 16 One-way Analysis of Variance Major Points • An example • The logic • Calculations • Unequal sample sizes • Multiple comparisons • Fisher’s LSD • Bonferroni t Cont.
Chapter 16 One-way Analysis of Variance Major Points--cont. • Assumptions of analysis of variance • Magnitude of effect • eta squared • omega squared • d • Review questions
Chapter 16 One-way Analysis of Variance Logic of the Analysis of Variance • Null hypothesis H0 : Population means equal • m1 = m2 = m3 = m4 • Alternative hypothesis: H1 • Not all population means equal. Cont.
Chapter 16 One-way Analysis of Variance Logic--cont. • Create a measure of variability among group means • MSgroups • Create a measure of variability within groups • MSerror Cont.
Chapter 16 One-way Analysis of Variance Logic--cont. • Form ratio of MSgroups /MSerror • Ratio approximately 1 if null true • Ratio significantly larger than 1 if null false • “approximately 1” can actually be as high as 2 or 3, but not much higher
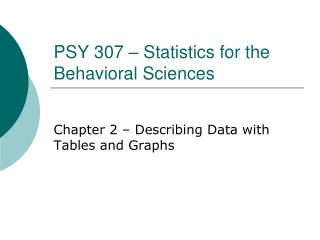
Chapter 16 One-way Analysis of Variance Epinephrine and Memory • Based on Introini-Collison & McGaugh (1986) • Trained mice to go left on Y maze • Injected with 0, .1, .3, or 1.0 mg/kg epinephrine • Next day trained to go right in same Y maze • dep. Var. = # trials to learn reversal • More trials indicates better retention of Day 1 • Reflects epinephrine’s effect on memory
Chapter 16 One-way Analysis of Variance Grand mean = 3.78
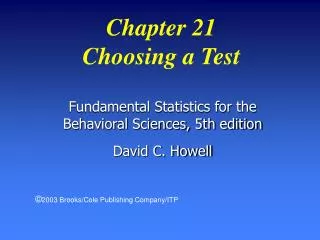
Chapter 16 One-way Analysis of Variance Calculations • Start with Sum of Squares (SS) • We need: • SStotal • SSgroups • SSerror • Compute degrees of freedom (df ) • Compute mean squares and F Cont.
Chapter 16 One-way Analysis of Variance Calculations--cont.
Chapter 16 One-way Analysis of Variance Degrees of Freedom (df ) • Number of “observations” free to vary • dftotal = N - 1 • Variability of N observations • dfgroups = g - 1 • variability of g means • dferror = g (n - 1) • n observations in each group = n - 1 df • times g groups
Chapter 16 One-way Analysis of Variance Summary Table
Chapter 16 One-way Analysis of Variance Conclusions • The F for groups is significant. • We would obtain an F of this size, when H0 true, less than one time out of 1000. • The difference in group means cannot be explained by random error. • The number of trials to learn reversal depends on level of epinephrine. Cont.
Chapter 16 One-way Analysis of Variance Conclusions--cont. • The injection of epinephrine following learning appears to consolidate that learning. • High doses may have negative effect.
Chapter 16 One-way Analysis of Variance Unequal Sample Sizes • With one-way, no particular problem • Multiply mean deviations by appropriate ni as you go • The problem is more complex with more complex designs, as shown in next chapter. • Example from Foa, Rothbaum, Riggs, & Murdock (1991)
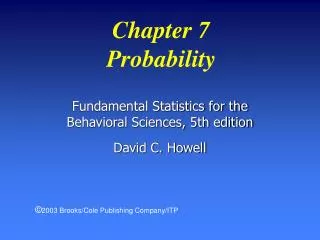
Chapter 16 One-way Analysis of Variance Post-Traumatic Stress Disorder • Four treatment groups given psychotherapy • Stress Inoculation Therapy (SIT) • Standard techniques for handling stress • Prolonged exposure (PE) • Reviewed the event repeatedly in their mind Cont.
Chapter 16 One-way Analysis of Variance Post-Traumatic Stress Disorder--cont. • Supportive counseling (SC) • Standard counseling • Waiting List Control (WL) • No treatment
Chapter 16 One-way Analysis of Variance SIT = Stress Inoculation Therapy PE = Prolonged Exposure SC = Supportive Counseling WL = Waiting List Control Grand mean = 15.622
Chapter 16 One-way Analysis of Variance Tentative Conclusions • Fewer symptoms with SIT and PE than with other two • Also considerable variability within treatment groups • Is variability among means just a reflection of variability of individuals?
Chapter 16 One-way Analysis of Variance Calculations • Almost the same as earlier • Note differences • We multiply by nj as we go along. • MSerror is now a weighted average. Cont.
Chapter 16 One-way Analysis of Variance Calculations--cont.
Chapter 16 One-way Analysis of Variance Summary Table F.05(3,41) = 2.84
Chapter 16 One-way Analysis of Variance Conclusions • F is significant at a = .05 • The population means are not all equal • Some therapies lead to greater improvement than others. • SIT appears to be most effective.
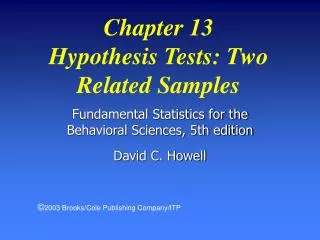
Chapter 16 One-way Analysis of Variance Darley & Latene (1968) Condition: Alone One Other Four Others n 13 26 13 X .87 .72 .51
Chapter 16 One-way Analysis of Variance Darley & Latene (1968)
Chapter 16 One-way Analysis of Variance Multiple Comparisons • Significant F only shows that not all groups are equal • We want to know what groups are different. • Such procedures are designed to control familywise error rate. • Familywise error rate defined • Contrast with per comparison error rate
Chapter 16 One-way Analysis of Variance More on Error Rates • Most tests reduce significance level (a) for each t test. • The more tests we run the more likely we are to make Type I error. • Good reason to hold down number of tests
Chapter 16 One-way Analysis of Variance Fisher’s LSD Procedure • Requires significant overall F, or no tests • Run standard t tests between pairs of groups. • Often we replace s 2j or pooled estimate with MSerror from overall analysis • It is really just a pooled error term, but with more degrees of freedom--pooled across all treatment groups.
Chapter 16 One-way Analysis of Variance Bonferroni t Test • Run t tests between pairs of groups, as usual • Hold down number of t tests • Reject if t exceeds critical value in Bonferroni table • Works by using a more strict value of a for each comparison Cont.
Chapter 16 One-way Analysis of Variance Bonferroni t--cont. • Critical value of a for each test set at .05/c, where c = number of tests run • Assuming familywise a = .05 • e. g. with 3 tests, each t must be significant at .05/3 = .0167 level. • With computer printout, just make sure calculated probability < .05/c • Necessary table is in the book
Chapter 16 One-way Analysis of Variance Assumptions for Anal. of Var. • Assume: • Observations normally distributed within each population • Population variances are equal • Homogeneity of variance or homoscedasticity • Observations are independent Cont.
Chapter 16 One-way Analysis of Variance Assumptions--cont. • Analysis of variance is generally robust to first two • A robust test is one that is not greatly affected by violations of assumptions.
Chapter 16 One-way Analysis of Variance Magnitude of Effect • Eta squared (h2) • Easy to calculate • Somewhat biased on the high side • Formula • See slide #33 • Percent of variation in the data that can be attributed to treatment differences Cont.
Chapter 16 One-way Analysis of Variance Magnitude of Effect--cont. • Omega squared (w2) • Much less biased than h2 • Not as intuitive • We adjust both numerator and denominator with MSerror • Formula on next slide
Chapter 16 One-way Analysis of Variance h2 and w2 for Foa, et al. • h2 = .18: 18% of variability in symptoms can be accounted for by treatment • w2 = .12: This is a less biased estimate, and note that it is 33% smaller.
Chapter 16 One-way Analysis of Variance Other Measures of Effect Size • We can use the same kinds of measures we talked about with t tests. • Usually makes most sense to talk about 2 groups at a time, rather than a measure averaged over several groups.
Chapter 16 One-way Analysis of Variance Review Questions • Why is it called the analysis of “variance” and not the analysis of “means?” • What do we compare to create our test? • Why would large values of F lead to rejection of H0? • What do we do differently with unequal n ’s? Cont.
Chapter 16 One-way Analysis of Variance Review Questions--cont. • What is the per comparison error rate? • Why would the familywise error rate generally be larger than .05 unless it is controlled? • Most instructors hate Fisher’s LSD. Can you guess why? • Why should they not hate it? Cont.
Chapter 16 One-way Analysis of Variance Review Questions--cont. • How does the Bonferroni test work? • What assumptions does the analysis of variance require? • What does “robust test” mean? • What do we mean by “magnitude of effect?” • What do you know if h2 is .60? Cont.
Chapter 16 One-way Analysis of Variance Review Questions—cont. • Why would we calculate effect size measures on only pairs of groups at a time?