Download

1 / 60
600 likes | 783 Vues
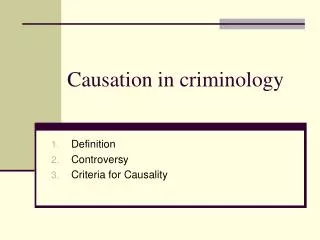
Women & Crime. Perpetrators & Victims. 1. Outline. I. Arrest rates for Women Vs. Men II. Labor Force Trends For Women III. Violence Amongst Intimates IV. Labor Market Analysis for Women V. Demographic Trends VI. Forcible Rape VII. International Traffic in Women. 2.

E N D
Women & Crime Perpetrators & Victims 1
Outline • I. Arrest rates for Women Vs. Men • II. Labor Force Trends For Women • III. Violence Amongst Intimates • IV. Labor Market Analysis for Women • V. Demographic Trends • VI. Forcible Rape • VII. International Traffic in Women 2
Conclusions • Women are becoming more involved in crime • Women do not like confrontational types of crime • Not so much into violent crime or robbery • As women work, opportunities change • Embezzlement by women increasing • Prostitution decreasing 13
Labor Force Trends For Women Meg Whitman: E-Bay/ Candidate for Governor/ CEO of Hewlett-Packard Rosie the Riveter During WWII 14
Labor Force Trends For Women • In 1948, nearly one third of women participated in the labor force. By 2008, nearly sixty percent of women participated in the labor force • In 1973, women accounted for 38.5% of national employment. By 2010, this number was over 47 %. 15
Household Survey Employed, E Labor Force, LF Civilian Non-institutional Population, CNIP Unemployed, U Not In The Labor Force, NLF Labor Force Participation Rate, ρ = LF/CNIP 17
Labor Force Trends For Women • As more women left the role of house wife for the labor force, the nature of the home changed • As women became a larger presence in the workplace, the nature of the workplace changed 18
In Contrast: Labor Force Partipation Rate Trends For Young Men, 16-24 19
A statistical analysis of the US property crime rate from 1960 through 2010 was conducted, and the crime rate was positively correlated with the labor force participation rate for men ages 16-24, lagged two years, and negatively correlated with the labor force participation rate for women, lagged three years. 21
III. Violence Amongst intimatesI • http://bjs.ojp.usdoj.gov/content/intimate/ipv.cfm 23
IV. Labor Force Analysis for Women Using Illustrative Muliplicative Preferences U =(Y –Y0 ) 0.5 (L - L0 ) 0.5 • y0 = committed income, credit card payments and mortgage payments etc. • L0 = committed leisure, things you have to do around the house such as take care of the kids (soccer mom) 31
Fifties and Sixties • Male was the bread-winner, female did the chores around the house 32
U =(Y –Y0 ) 0.5 (L - L0 ) 0.5 ,y0 =0 = L0 8 hours work, $25/hr 33
Housewife with $150/day of Husband’s $200/day for Household • Treat $150/day as her non-labor income so less likely to work • Possibly the story in the fifties and sixties 35
Housewife with $150 of Husband’s $200 Non-labor Income At most wants to work ~ 4 hours 36
Single woman with Kids & Alimony • Ten hours of committed leisure • U =(Y – 0)0.5 (L – 10)0.5 37
Single Woman with Kids & Alimony Alimony 0 5 0 Wants to work at most six 38
Single Woman with Kids, No Alimony, & $150/day of Committed Income origin Wants to work ~ 8 hours 39
Modern Woman, Husband Earns $200/day, expenses plus mortgage amounts to $250/day: works 8 hours origin Wants to work ~ 8 hours/day 40
Age At First Marriagehttp://www.userniche.com/LoveAndDivorce/ASP/UserNicheMainPage.asp?ID=23 42
V. Relationship Trends • Marriage Rates • Divorce Rates • Birth Rates 43
Where Did All the Married Women Go? How Long Will You Be Married? 48
OECD Marriage & Divorce Rateshttp://www.oecd.org/dataoecd/4/19/40321815.pdf 50