
Product Financial Performance Analysis: Q3 Report Overview
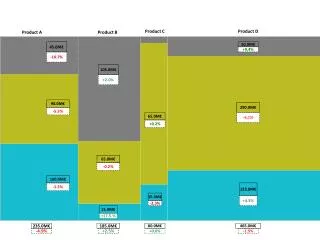
This report provides a comprehensive analysis of the financial performance of our product categories for Q3. Highlights include a 9.4% increase in Product A, while Product B experienced a 2.0% growth. Product C faced challenges, showing a decline of 5.3%, and Product D had a steady performance with a minor decrease of 1.3%. Overall, our sales totaled 290.0M€, reflecting a -4.9% change compared to the previous quarter. These insights will guide our strategic decisions moving forward in the competitive market landscape.

Product Financial Performance Analysis: Q3 Report Overview
E N D
Presentation Transcript
Product C Product D Product A Product B 45.0M€ 50.0M€ +9,4% -10.7% 105.0M€ +2.0% 90.0M€ 290.0M€ -5.3% -6,1% 65.0M€ +0.2% 65.0M€ -0.2% 100.0M€ 125.0M€ -1.3% 15.0M€ +4.3% -2.3% 15.0M€ +17.5.% 235.0M€ 185.0M€ 80.0M€ 465.0M€ -4.9% +2.5% +0.0% -1.9%
Product C Product D Product A Product B 45.0M€ 50.0M€ 105.0M€ 90.0M€ 290.0M€ 65.0M€ 65.0M€ 100.0M€ 125.0M€ 15.0M€ 15.0M€