Using Data to Reduce Error, Standardize Practice and Improve Patient Outcomes
620 likes | 799 Vues
Using Data to Reduce Error, Standardize Practice and Improve Patient Outcomes. James H. Nichols, Ph.D., DABCC, FACB Associate Professor of Pathology Tufts University School of Medicine Director, Clinical Chemistry Baystate Health System Springfield, Massachusetts james.nichols@bhs.org.

Using Data to Reduce Error, Standardize Practice and Improve Patient Outcomes
E N D
Presentation Transcript
Using Data to Reduce Error, Standardize Practice and Improve Patient Outcomes James H. Nichols, Ph.D., DABCC, FACB Associate Professor of Pathology Tufts University School of Medicine Director, Clinical Chemistry Baystate Health System Springfield, Massachusetts james.nichols@bhs.org
Baystate Health System • Baystate Medical Center - tertiary care • 572 beds, 3rd largest acute care in NE • 40,000 discharges/200,000 inpatient days (4.7 mean LOS) • 600,000 ambulatory visits • Western Campus of Tufts School of Medicine • Franklin and Mary Lane Hospitals • Over 40 Ambulatory Care Practices (1 million visits) • Home nursing and assisted care (156,000 visits) • Reference Lab (BRL) - 4 million tests/year • Clin Chemistry - Core 1 Roche TLA (2500/day)
Medical Errors • Institute of Medicine of the National Academies report 1999 • Medical errors kill 44,000 - 98,000 patients in US hospitals each year. • “Number one problem facing health care” Lucien Leape, Harvard Professor of Public Health
Medical Errors • 2002 Commonwealth Fund report estimated that 22.8 million people have experienced a medical error, personally or through at least one family member • Reinforces the 1999 IOM report, “To Err is Human” • Annual costs estimated at $17 – 29 billion • US Agency for Healthcare Research and Quality (AHRQ) estimate medical errors are the 8th leading cause of death in the US – higher than: • Motor Vehicle Accidents (43,458) • Cancer (42,297) • AIDS (16,516)
Laboratory Errors • Typically think patient, tube or aliquot mix-up. • Other, more insidious errors to consider • Overutilization of testing – “fishing” • Inappropriate use of testing – method selection or test for symptoms, screening vs management • Misunderstanding – wrong test, assume ‘test is a test’ • Delays – ordering, receipt of result, clinical action
Laboratory Errors • A minireview of the literature found the majority of errors occur in the pre and post analytical phases. Bonini P, Plebani M, Ceriotti F, Rubboli F. Clin Chem 2002;48:691-698. • Many mistakes are referred to as lab error, but actually due to poor communication, actions by others involved in the testing process, or poorly designed processes outside the lab’s control. • Medical errors occur in prevention, diagnosis and drug treatment occur. Among errors in diagnosis; 50% were failure to use indicated tests, 32% were failure to act on results of tests, and 55% involved avoidable delay in diagnosis. Leape LL, Brennan TA, Laird N, et al. N Eng J Med 1991;324:377-84.
Man A creature made near the end of the week when God was tired. Mark Twain
Medical Errors • The Person • Easier to blame a person than an institution for errors. • In aviation, 90% of quality lapses are judged to be blameless. • The System • Active failures due to personal interaction with system • Latent conditions, weaknesses in system due to design flaws or heirarchical decisions • Need to engineer systems that prevent dangerous errors and are able to tolerate errors and contain their effects Reason J. BMJ 2000;320:768-770.
Automation • Collects raw data and processes to information (trends) • Reduces practice variability (device prompts) • Consolidates operator interactions (barcoding) • Assists decision-making (internal checks for QC pass, expiration dates, operator ID) • When linked to information management and data algorithms can warn of possible errors (delta checks, device flags like inadequate sample, analyzer interferences)
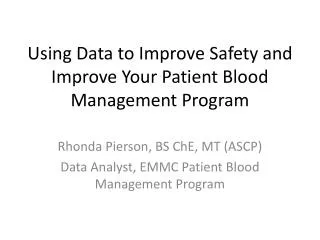
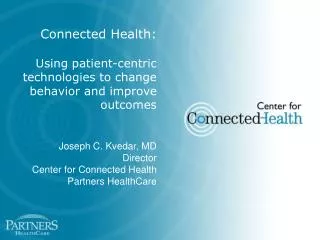
Hemolysis in the ED • Coagulation specimens must be rejected if hemolyzed and recollected • Inpatient rates of hemolysis are typically <1% • ED had rates approaching 20% or more • Related to implementation of a flexible catheter and practice of collecting blood through lines • Manufacturer even distributed a customer warning against collecting blood through this catheter • Yet, ED unwilling to change practice – customer satisfaction issue and comfort level of IV lines • Number of redraws and delays of ED patients led to elimination of practice.
Phlebotomy Hemolysis Rates Implement Practice Change
Middleware • Data server sits between an analyzer and LIS/HIS • POCT servers are a form of Middleware • Allows data processing before sending results LIS, also functions as data repository for report searches • Common current uses – autoverification, insertion of data flags for H/I/L indices • More sophisticated functions are limited only by imagination of the lab
Clinical Alarms • Critical pathway ordering practices and variant ordering practices • Hct level and POCT glucose testing • Medication (propofol) and potential test interference (i-Stat) • Insulin dose, individual response and prediction of future dose • Disease/medication (high blood pressure/loop diuretics) vs predicted lab result (low K) vs questionable lab results (high K) • Medical devices (flexible catheters) and potential for hemolysis and laboratory interference
POCT Error Management • POCT – diagnostic testing conducted close to the site where clinical care is delivered • POCT error rates are not known in literature • POCT conducted by nursing but managed by lab • Requires considerable interdisciplinary communication to deliver effectively • POCT QI can be a tool to uncovering ongoing errors and addressing system weaknesses
Reducing Errors through Automation • Newer POCT devices have data management • Prompts operator to perform testing same way every time • Lock-outs act as internal “fail-safes” to prevent a patient result if QC fails, not performed or operator is not certified for testing. • Feb 2004 CLIAC meeting discussion of possible changes to CLIA waived category suggested that waived tests have • fail-safe or failure alert mechanisms whenever possible • include QC materials with kits • specimens requiring significant manipulation not be waived
Medical Errors • The Person • Easier to blame a person than an institution for errors. • In aviation, 90% of quality lapses are judged to be blameless. • The System • Active failures due to personal interaction with system • Latent conditions, weaknesses in system due to design flaws or heirarchical decisions • Need to engineer systems that prevent dangerous errors and are able to tolerate errors and contain their effects Reason J. BMJ 2000;320:768-770.
Patient Identification Errors • POCT results are transmitted to the POCT manager when devices are downloaded • The data manager orders and results the test in the LIS • If the test does not match an active patient account the data manager holds the result for resolution • Compliance problems as test cannot be billed, and some results transmitted to incorrect patient record and inappropriate medical management
Failure Mode and Error Analysis • FMEA identifies an error • Outlines possible steps that could lead to the error. • Identifies the reasoning behind the various pathways, why they exist and ways that paths can be improved. • Establishes quantitative monitors and the means of measuring improvement. • FMEA improves motivation by seeking route causes of errors rather than placing blame.
ICU FMEA • Incidence of patient ID errors in our ICU led to an administrative demand for improved compliance or loss of privileges (3 strike rule) • Conducted FMEA analysis • ID errors due to multiple issues: • Long number entry (9 digits), transposition of numbers • Some devices can’t accept leading zeros • Patient wristbands are not legible (clin engineering) • Need for patient care, share operator IDs (retraining) • Barcoding seen as optimum solution
Barcoding • In practice, one of the more challenging projects to implement in an institution: • Devices only read specific barcode languages • Wristbands vary in durability • Ink isn’t permanent (thermal vs inkjet) • Devices don’t require barcode entry! • Try to engineer around manual entry by adding special characters or digits to ID • These work-arounds lengthen the barcode and increase read failure if barcode not flat on wrist. • How to print? Wristbands only or labels that an operator can stick onto device or paper towel? What about neonates?
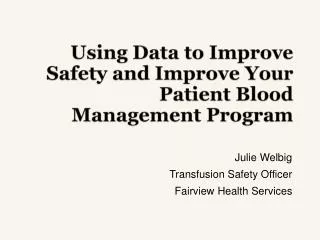
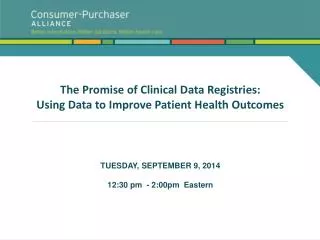
Barcoding • During implementation, operators continued to manually enter patient IDs due to the scanner failing on the 1st attempt • An investigation was conducted into why scanners fail • i-Stat scanners failed more frequently than glucose • Operator interaction with the POCT device was the primary determinant in scanner failure
P=0.014 P=0.0007
P=NS, 0.378 P=0.048
Barcoding • Barcode acceptance and difficulties in implementation lead to <100% effectiveness: • Manual entry • Barcoding patient with the wrong account or patient ID • Patients with multiple wristbands • Scanning the wrong barcode (lot number instead of patient) • From the AACC listserv, those successful institutions communicate the value of barcoding and have operators who have acknowledged the advantages and implement strategies to enhance success
Communication • How best to reach clinicians? • Errors are a system weakness and require an interdisciplinary system fix, one person is not responsible. • Utilize available resources: • Hospital Quality Improvement Teams • Peer-Reviewed Literature • Practice Guidelines • Learn to speak ‘clinicalese’ – Use Clinical Protocols
Portland Protocol • Examined glucose levels and surgical complications in 1,585 cardiac surgery patients with diabetes (990 preprotocol and 595 postprotocol) • Implemented protocol of postoperative intravenous insulin to maintain glucose <200 mg/dL. • Intensive monitoring and insulin therapy on hospitalized inpatients lowers blood glucose levels in the first 2 postoperative days with concomitant decrease in proportion of patients with deep wound infections (2.4% vs 1.5%, p<0.02) Zerr KJ et al. Ann Thorac Surg 1997;63:356-61.
Portland Protocol • ACC/AHA Guidelines for CABG Surgery “Another patient characteristic that has been associated with postoperative mediastinitis is the presence of diabetes, especially in patients requiring insulin. In addition to the microvascular changes seen in diabetic patients, elevated blood glucose levels may impair wound healing. The use of a strict protocol aimed at maintaining blood glucose levels 200 mg/dL by the continuous, intravenous infusion of insulin has been shown to significantly reduce the incidence of deep sternal wound infection in diabetic patients.” Eagle KA, Guyton RA. JACC 1999;34:1262-1347.
Portland Protocol • q1hr until glucose 125-175 with <15 mg/dL change and insulin rate unchanged x4 hrs. Then q2hr. • Weaning vasopressors (Adrenalin) check q30min until stable • Stop q2hr testing on POD #3 • Test q2hr during the night on telemetry if glucose <200
Portland Protocol Operational Issues • Which method to utilize? [TAT, Accuracy] • Glucose meter – glucose oxidase • Blood Gas glucose – glucose oxidase • Core laboratory glucose - hexokinase • Preferred sample? [Method, Line Contamination] • Whole blood or plasma • Fingerstick, line draw or venipuncture
Unmodified direct-reading biosensor result ”relative molality” of glucose in plasma or whole blood (not recommended) 1.18 0.94 Concentration of glucose in plasma (recommended) Concentration of glucose in whole blood (not recommended) 1.11 Fig. 1. Conversion factors for different quantities of glucose.
Meter Performance Criteria ADA ‘87 All Levels ± 15% ADA ‘94 All Levels ± 5% Agence du Médicament < 100 mg/dL ± 20 mg/dL (95% of data) 100 mg/dL ± 20% (CV <7.5%) CSA < 45 mg/dL ± 25% (CV<12.5%) 90 mg/dL ± 15% (CV <7.5%) FDA < 100 mg/dL ± 20 mg/dL (95% of data) 100 mg/dL ± 20% ISO < 100 mg/dL ± 20 mg/dL (95% of data) 100 mg/dL ± 20% IMSS < 60 mg/dL ± 25% 60 mg/dL ± 20% NCCLS (C30A) < 100 mg/dL < 15 mg/dL 100 mg/dL ± 20% TNO < 117 mg/dL ± 20 mg/dL 117 mg/dL ± 15% mg/dL (CV <10%)
Quality Specification Modeling • Monte Carlo simulation to generate random “true” and “measured” glucose based on mathematical model of meters having defined imprecision and bias. (N=10,000 - 20,000 pairs) Analytical error Insulin dose errors 5% 8 - 23% 10% 16 - 45% • 2x or greater insulin dosage errors >5% of time when analytic error exceeded 10 - 15% • Total error < 1 - 2 % required to provide intended insulin >95% of time. • Boyd JC. Bruns DE. Quality specifications for glucose meters: Assessment by simulation modeling of errors in insulin dose. Clin Chem 2001;47:209-214
Portland Protocol • Glucose meters may or may not be applicable for tight management, as can vary by +/-20% in the 100–200 mg/dL range. • Blood gas and some analyzers perform better than glucose meters, may be more appropriate in these cases. • Should be a clinical not a laboratory decision, role of laboratory to inform not dictate method
Clinical Protocols • Clinical protocols provide a pathway of care to manage patients with specific disorders in the most effective manner for optimum patient outcome. • Incorporating laboratory testing into clinical protocols standardizes practice, reduces practice variability, ensures appropriate ordering of tests and can assist the interpretation of test results. • Clinical protocols are a good means of communicating with clinicians and providing reminders or important components of decision-making
2004 National Patient Safety Goals - JCAHO • Improve the accuracy of patient identification • Improve the effectiveness of communication among caregivers • Improve the safety of using high-alert medications • Eliminate wrong-site, wrong patient, wrong-procedure surgery • Improve the safety of using infusion pumps. • Improve the effectiveness of clinical alarm systems. • Reduce the risk of healthcare-acquired infections.
NACB Laboratory Medicine Practice Guidelines – Evidence Based Practice for POCT • Clinicians, staff and laboratorians need guidance to apply POCT in the most effective manner for patient benefit. • This guidance should be based on a concurrence of the scientific evidence to date. • This need for evidence-based practice was the concept behind the NACB Laboratory Medicine Practice Guidelines for POCT
Evidence-Based Practice for POCT • POCT is an increasingly popular means of delivering laboratory testing. • When used appropriately, POCT can improve patient outcome by providing a faster result and therapeutic intervention. • However, when over-utilized or incorrectly performed, POCT presents a patient risk and potential for increased cost of healthcare. • This LMPG will systematically review the existing evidence relating POCT to patient outcome, grade the literature, and make recommendations regarding the optimal utilization of POCT devices in patient care. • Develop liaisons with appropriate professional, clinical organizations: ACB, ADA, ACOG, CAP, etc.
Evidence-Based Practice for POCTFocus Group Chairs • Cardiac – Robert H. Christenson, Ph.D. • Diabetes – Christopher Price, Ph.D. • Reproduction – Ann M. Gronowski, Ph.D. • Infectious Disease – Robert Sautter, Ph.D. • Coagulation – Marcia Zucker, Ph.D. • Parathyroid – Lori J. Sokoll, Ph.D. • Drugs – Ian Watson, Ph.D. • Bilirubin Screening – Steven Kazmierczak, Ph.D. • Critical Care – Greg Shipp, Ph.D. • Renal – William A. Clarke, Ph.D. • Occult Blood – Kent Lewandrowski, M.D. • pH – James Nichols, Ph.D. • Introductory Comments – Ellis Jacobs, Ph.D.
Evidence Based Practice for POCTpH Guidelines I • Does the use of pH paper for assisting the placement of nasogastric tubes, compared to clinical judgment (air, pressure) improve the placement of tubes on inpatient, endoscopy, home care and nursing home patients? • We recommend the use of pH testing to assist in the placement of nasogastric tubes. The choice of measuring pH with an intragastric electrode or testing tube aspirates with a pH meter or pH paper will depend on consideration of the clinical limitations of each method, and there is conflicting evidence over which method is better. (Class II – prospective comparative trials and expert opinion)