Download
1 / 33
330 likes | 356 Vues
This study explores the relationship between surface warming and precipitation efficiency in radiative-convective equilibrium. It investigates factors influencing precipitation efficiency and their effects on climate models' projections of future changes in the hydrologic cycle.

E N D
Increase in Precipitation EfficiencyWith SurfaceWarming inRadiative-Convective Equilibrium Lutsko, N. J., and T. W. Cronin, 2018: Increase in precipitation efficiency with surface warming in radiative-convective equilibrium. J. of Advances in Modeling Earth Systems, 10, 2992–3010.
Introduction • The precipitation efficiency of convection is a measure of how much of the water that condenses in a rising column of air reaches the surface as precipitation. P : surface precipitation rate (kg m−2 s−1) C : column-integrated condensation rate (kg m−2 s−1)
Many factors contribute to the precipitation efficiency: • the various microphysical processes autoconversion rate, the fall speeds of the hydrometeors • cloud-scale dynamics entrainment rates • precipitation efficiency can be tuned quite precisely in some global climate models (GCMs; Zhao, 2014), and several recent studies have found a strong relationship between climate sensitivity and the response of 𝜖 to warming (Mauritsen et al., 2012; Tomassini et al., 2015; Zhao, 2014; Zhao et al., 2016). • the precipitation efficiency decreases in warmer conditions are able to maintain greater amounts of cloud cover and thus have a more negative cloud feedback(Sherwood et al., 2014; Zhao, 2014). • 𝜖 is also an important factor in models’ projections of future changes in the hydrologic cycle, and influences the rate at which aerosols are removed from the atmosphere (Bailey et al., 2015).
Model and Experiments • Model: System for Atmospheric Modeling version 6.10.8 (SAM; Khairoutdinov & Randall, 2003). • Gravity waves are damped at the top of the domain • subgrid-scale fluxes are parameterized using Smagorinsky’s eddy diffusivity model. • A small amount of white noise added to the temperature field near the surface to initiate convection. 1. small domain simulation: Periodic domain 2. mock-Walker simulation: fixed SSTs Y =96 km Periodic domain sinusoidal SST profile Z = 64 levels (50 m 1 km) X = 24,576 km, (Periodic domain) X = 96 km,
in order to test the sensitivity of 𝜖 to the microphysical scheme • Two single-moment scheme: • Khairoutdinov and Randall (2003) K03 • “NOSEDAALIQ5” setup of Lopez et al. (2009) NA5 • One double-moment scheme: • Morrison et al. (2005) M05
Diagnostic Framework • a similar framework to Langhans et al. (2015) to diagnose the causes of changes in precipitationefficiency. • The total precipitation reaching the surface: cloud condensate re-evaporation C: column-integrated condensation rate E : column-integrated sink of precipitation due to evaporation
single-moment scheme : K03, NA5 double-moment scheme : M05 Small Domain Simulations Variation of 𝝐 With SST • 𝜖 increases monotonically as the SST is increased • In the simulations with the single-moment scheme 𝛼 increases monotonically with SST • The changes of are small • the increasing precipitation efficiency is due to the increasing conversion efficiency
single-moment scheme : K03, NA5 double-moment scheme : M05 Small Domain Simulations Variation of 𝝐 With SST
In the single-moment microphysics, autoconversion is carried out by a fractional removal scheme, which takesthe form qp : mixing ratio of a precipitating species 𝜂 : autoconversion rate coefficient qc : mixing ratio of a cloud condensate qc,0 : a threshold condensate mixing ratio
probability density functions of mixing ratio of cloud condensate at the altitudes of maximum time-mean condensation • before reaching a cutoff value after which the probability density decays more rapidly • The slopes of the PDFs weaken, and the cutoff values increase as the underlying SST is increased Dash line: qc, 0
Changes in Precipitation Evaporation • re-evaporation of falling precipitation: RH : relative humidity t : average fall time h :the average height at which precipitation forms w : the average fall speed • RH is calculated as the mean relative humidity weighted by the mass of falling precipitation at each level: Overline : domain average qp: the sum of the mixing ratios of all precipitating species • average fall speed of the precipitation
the M05 simulations reflect differences in the microphysics controlling how rain and snow are evaporated in the double-moment scheme
h w t
Sensitivity to Resolution • compares the precipitation efficiencies in simulations with the K03 microphysics and grid sizes of 0.5, 1, and 2 km. • The efficiencies decrease as the grid size decreases. • Re-evaporation is unaffected by changing the grid size.
the average cloud density decreases as the grid size decreases • the rate of entrainment of environmental air into convecting plumes increases as the grid size decreases, reducing the cloud condensate mixing ratios.
The 2-D Mock-Walker Simulations 𝜖 𝛼 1 − 𝛽 • the precipitation efficiencies increase with warming up to 300 K and then decrease. • the sedimentation efficiency is larger in these simulations than in the small domain simulations because the relative humidity in the precipitating regions is higher and hence the saturation deficit is lower.
the subsidence fraction of the domain with 𝜔500 > 0, Coppin & Bony, 2015 • the subsidence fraction decreases by∼15% when going from290 K to 297.5 K with all three schemes • and increases at warmer SSTs
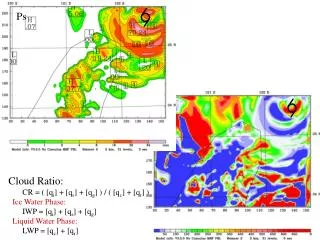
narrow regions of deep convection over the warmest SSTs and low clouds decks outside these regions • In the 300 K case the strongest convection is over the warmer SSTs, but it is less intense and the low cloud decks are less well defined • Although the low clouds have large cloud condensate mixing ratios, they have small precipitation efficiencies.
The simulation results with K03 scheme • The values are averaged over 192-km blocks • the dashed lines separate regions of subsidence from regions of ascent, based on the pressure velocity 𝜔 at 500 hPa.
PDFs of qc for the 290 K simulation with the K03 scheme region of low cloud cover region of deep convection
This progression is associated with changes in the large-scale circulation, which goes from a single, large overturning cell in the coldest simulations to a double-cell structure in the warmest cases
Summary and Conclusion • small domain simulations : • In the single-moment simulations, precipitation efficiency generally increases with warming • clouds become denser and so cloud condensate is converted more efficiently into precipitation • Changes in the re-evaporation of precipitation are small • In the double-moment simulations, large reductions in the amount of snow with warming for SSTs lower than 300 K • the precipitation efficiency decreases at finer resolutionsbecause the cloud density decreases
in the 2-D Walker simulations: • The precipitation efficiency increases up to about 300 K and then decreases with further warming - large-scale circulation, organization of convection • the precipitation efficiency increases withsurface warming but may decrease due to changes in the abundances of the different precipitating phasesor in the degree of convective organization.
abstract • A particularly urgent question is how 𝜖 will change in warmer climates. • this study investigates the precipitation efficiency in simulations of radiative-convective equilibrium with a cloud-resolving model forced by a wide range of sea surface temperatures (SSTs). • The precipitation efficiency of convection generally increases with warming in the small domain simulations because of increases in the efficiency with which cloud condensate is converted into precipitation, with changes in the re-evaporation of falling precipitation playing a secondary role. • This picture is complicated in the 2-D simulations by substantial changes in the degree of convective organization as the underlying SSTs are varied. • 𝜖 is found to decrease as convection becomes more organized, because convective organization results in relatively more low clouds, which have small (≤0.1) precipitation efficiencies, and relatively less high clouds, which have larger (∼0.4) precipitation efficiencies.
the only theoretical constraint on precipitation efficiency comes from Romps (2014), who showed that in the entraining plume model with condensation • 𝜖 should decrease as relative humidity increases, but this is not a very stringent constraint, and applies only when convection behaves as a single entraining plume. • In simulations Romps found that 𝜖 was sometimes twice as large as the 1−RH lower bound. 𝜖e : precipitation efficiency calculated using the precipitation flux at height z P(z) : precipitation flux at height z C(z): the integrated condensation above the height z. As z → 0, 𝜖e approaches the 𝜖 defined in the first paragraph.
Three sets of simulations were performed with each setup in order to test the sensitivity of 𝜖 to the microphysical scheme. • Two sets of simulations used the single-moment microphysics scheme implemented in SAM by Khairoutdinov and Randall (2003), one with the original parameter settings described by Khairoutdinov and Randall (2003), and one with the “NOSEDAALIQ5” setup of Lopez et al. (2009). • In this configuration there is no ice sedimentation, the ice autoconversion threshold is lowered by a factor of 100, and the autoconversion and accretion rates for liquid water are increased by a factor of 5. • Harrop and Hartmann (2016) showed that this configuration produces more realistic atmospheric cloud radiative heating profiles than the original configuration of Khairoutdinov and Randall (2003). • We will refer to the two sets of single-moment simulations as the “K03” and “NA5” simulations, respectively. • The third set of simulations used the double-moment scheme of Morrison et al. (2005) and will be referred to as the “M05” simulations.
A variable time step is used, with maximum interval 10 s, and radiative fluxes are calculated every 40 time steps using the CAM radiation scheme. • The incoming solar radiation is fixed at 650.83 W/m2 with a zenith angle of 50.5∘ (Tompkins & Craig, 1998), producing a net insolation close to the tropical-mean value, and the simulations were initialized with a small amount of white noise added to the temperature field near the surface to initiate convection. • Greenhouse gases are fixed at present day levels and the mean SST is varied in increments of 2.5 K from 290 K to 310 K in both setups. • Simulations with SSTs less than 300 K were run for 150 days, with averages taken over the last 50 days. • The simulations with higher SSTs equilibrated more quickly, and so these were run for 100 days, and averages were again taken over the last 50 days. • The SSTs in the mock-Walker simulations have a sinusoidal profile, with the difference between the warmest SSTs (plotted in the center of the domain) and the coldest SSTs kept fixed at 5 K, which creates a comparable SST gradient to the equatorial Pacific.
the main differences between the two schemes are as follows: • single-moment scheme: • the autoconversion of cloud condensate : Kessler formulation • droplet collection : continuous growth equations double-moment Morrison scheme : • the autoconversion of cloud droplets to rain : stochastic collection of Beheng (1994) • the autoconversion of cloud ice to snow : a vapor diffusion growth rate • the collection of droplets by falling hydrometeors : a gravitational collection kernel • the phase of nonprecipitating and precipitating condensates: • single-moment scheme : diagnosed from the temperature • Morrison scheme : cloud ice is assumed to melt at 273.15 K, homogeneous freezing of cloud liquid water and rain occurs for temperatures below 233.15 K, the phase of condensates between these temperatures is simulated prognostically by the model. • the size distributions of precipitating hydrometeors : • the single-moment scheme: Marshall and Palmer (1948) distributions • Morrison scheme : gamma distributions • The two schemes have slightly different formulations of the terminal fall velocities of both rain and snow, as well as of the sedimentation rate of cloud ice. • In both schemes, the evaporation of rain and the sublimation of snow are modelled by vapor diffusion, but the formulations are different.