Customer Satisfaction Survey
Customer Satisfaction Survey. June 3, 2013. Presenters //. Sharon Younger, Ph.D . Younger Associates. Thomas Sexton, Ph.D . M. Davis Company. Lana Suite Younger Associates. John Houghton, AICP Gresham Smith and Partners. Morris Davis M. Davis Company.

Customer Satisfaction Survey
E N D
Presentation Transcript
Customer Satisfaction Survey June 3, 2013
Presenters // Sharon Younger, Ph.D. Younger Associates Thomas Sexton, Ph.D. M. Davis Company Lana Suite Younger Associates John Houghton, AICP Gresham Smith and Partners Morris Davis M. Davis Company
Integrating TDOT’s Mission and Guiding Principles Survey results that deliver information necessary for TDOT to achieve its mission and provide a decision-making framework. Providing the Best Multimodal Transportation System in the Nation
Supporting the Update of the 25 Year Transportation Plan Trends • DemographicChanges • Travel Markets • Aging Infrastructure • Environment • New Technology • New Types of Fuels and Vehicles • Future Funding Survey Can Be A Vital Source of Public Input
Younger Associates // • Market Research firm with 22 years experience specializing in government, transportation and economic development • Strategic Communications assisting clients in effectively communicating data and complex information • Surveys for both statewide and multi-state regions across the U.S. Numerous surveys in Tennessee provide in-depth understanding of regional differences.
M. Davis and Company // • Established in 1985 and currently one of the largest minority-owned and operated research firms in the U.S. • Expertise in market research, program evaluation and development, policy and strategic planning and implementation. • Transportation practice established over fifteen years ago. • 100 computer-assisted telephone interviewing (CATI) stations • (40 at MDAC headquarters and 60 offsite). • Successful national data collection projects for Public Sector clients Bureau of Transportation Statistics • National Highway Traffic Safety Administration • Federal Transit Administration • U.S. Census Bureau • U.S. Department of Health and Human Services • U.S. Department of Housing and Urban Development
Gresham, Smith & Partners // • Team of professional planners, engineers and technicians headquartered in Nashville with 16 offices throughout the Southeast and Midwest • Quality transportation planning, design and construction services for federal, state and local projects • Extensive experience working with TDOT and MPOs, Cities and Counties in Tennessee, as well as GDOT, ALDOT, MDOT, and KYTC
Key Team Capabilities // • Proven capability to yield a high return on information (ROI) based on study design, methodology, analysis and operational utility • Successfully utilized Customer Satisfaction data to inform • strategic and tactical plans • education and information campaigns • support and outreach initiatives • Experience reaching multiple audiences and multiethnic residents with high response rates • Effectively utilize multi-mode (mail, telephone, Internet) data collection efforts to ensure representation and high response rates • Dual frame sampling • On-site call center, confidentiality officer, data security protocols
The Drivers of Customer Satisfaction // • Assessing customer satisfaction entails identifying the key drivers • Customer satisfaction is linked to engagement • We will build 5 models designed to identify the drivers of each measure of customer satisfaction • (Questions 1, 3, 4, 8, and 18). • The models will indicate the characteristics of respondents that relate to customer satisfaction and the strengths of each relationship.
Review & Assessment // Critical Phase: Conduct Interviews and Focus Groups
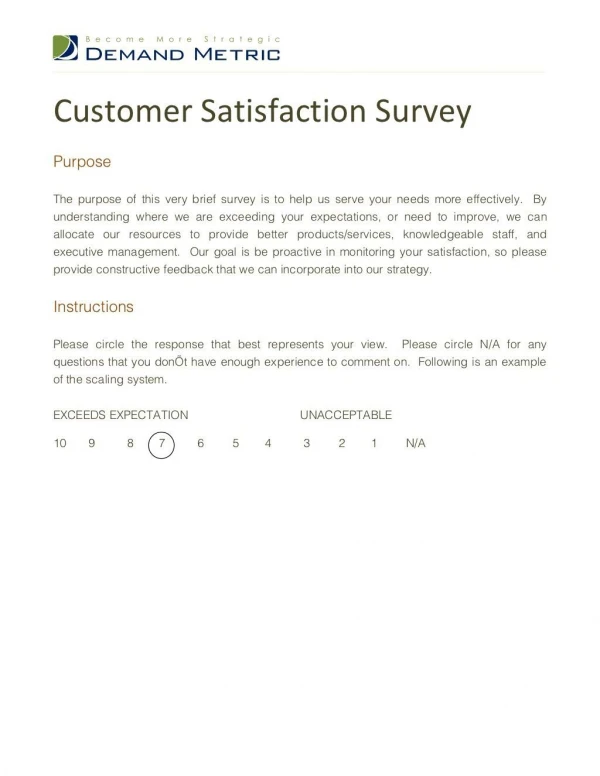
Survey Instrument Design // • TDOT wishes to “use factor analysis and regression analysis to determine the drivers of customer satisfaction.” • To do so, customer satisfaction data must be measured on an interval scale rather than on an ordinal Likert scale. • We will suggest ways to do so while allowing for comparison between the 2006 and 2013 data.
Survey Instrument Design // • Some survey questions ask the respondent to rank items in terms of “should receive the most emphasis” or “are the most important”. • Ranking fails to capture critical information: • How close are the ranked items? • How does the gap between first and second compare to the gap between second and third? • We will suggest ways to capture ratings rather than rankings to avoid this problem.
Avoiding Well-Known Problems // • See Allen, I. E. and Seaman, C. A. “Likert Scales and Data Analyses”, Statistics Roundtable, July 2007. • “Treating ordinal data as interval (or even ratio) data without examining the values of the dataset and the objectives of the analysis can both mislead and misrepresent the findings of a survey.” • “As a general rule, mean and standard deviation are invalid parameters for descriptive statistics whenever data are on ordinal scales, as are any parametric analyses based on the normal distribution.”
Comparing 2006 to 2013 // • Interval scales can always be converted to ordinal scales (but not vice versa). • For example, we might convert as follows: • Less than −60 → Very Dissatisfied • Between −60 and −20 → Dissatisfied • Between −20 and +20 → Neutral • Between +20 and +60 → Satisfied • Greater than +60 → Very Satisfied • We can then compare 2013 data with 2006 data using standard chi-square tests. • Future comparisons can be made with 2013 data using more powerful methods.
Survey Instrument Testing // • Pretesting will be conducted on all survey versions and on all data collection modes (telephone, mail, Internet). • All versions will be tested for comprehension, readability, appropriate question order, and logic. • All versions will be tested for survey length. • Cognitive testing will be conducted for telephone, mail and Internet modes, and for Spanish translation
Data Collection Methodology // • Geographically stratified sample will produce 95% confidence factor and +5% MOE at regional levels • Multi-mode methodology using address-based sample. • by mail • online • calling a toll-free number • receiving a telephone call • Telephone surveys will include landline and cell phones
Maximizing Response Rate // • Higher response rate achieved by providing residents with multiple ways to complete the survey. • Pre-notification letter 7 days prior to questionnaire mailing. • Follow-up phone call made by live interviewer beginning 2 weeks after questionnaire mailing. • Up to 8 telephone attempts on varied days, times of day. • Specially trained telephone interviewers used to avert refusals.
Benchmarking Survey of States // What does it mean to provide the best multimodal transportation system in the nation? How have other states defined the best multimodal transportation system? • Integrated Transportation and Land Use Planning • Intermodal Freight Centers • Cost Effectiveness • Complete Streets • Fix-It-First • Social Equity • Transportation Demand Management • Health and Safety • Environmental Stewardship • Transit Oriented Development • Context Sensitive Solutions • Multimodal Choices
Officials & Stakeholders Survey // • Multimodal • Mail • Online • Telephone • Survey team will work with the staff of elected officials to generate a high response rate • Telephone contact will insure proper stratification of responses in both surveys
Quality Control // • Built-in quality controls with (CATI) software and web survey software to automatically handle skip logic, check answer ranges, and ensure all questions are answered. • Close supervision and call monitoring for telephone interviews. • Validation checks for 10% of all completed mail, Internet and telephone surveys. • Double-entry validation on all mail surveys.
Modeling Methodologies // • Factor analysis is useful if the potential drivers are numerous and correlated. Factor analysis produces models with fewer independent variables but the independent variables are often difficult to interpret. We will employ several statistical modeling approaches. • Regression models overcome the interpretation difficulty but may suffer from collinearity. We will take great care to include only statistically significant variables and to take the standard steps necessary to minimize collinearity.
Research You Can Use // • North Carolina Department of Public Instruction • State adopted our efficiency-based funding formula • Began saving$17 million per year in operating expenses and eliminated hundreds of buses Kentucky and Tennessee Utility Providers • Used our customer satisfaction studies as basis for decisions to begin offering broadband services • Washington State Superintendent of Public Instruction • State adopted our regression-based formula for funding, and an efficiency-based formula to identify inefficient school districts.
Memphis is America’s Distribution Center • Runway • Eight Passenger Airlines • FedEx Super Hub • Top Cargo Airport • Road • Reach More Markets Overnight than from any other City • Rail • Five National Class 1 Rail Systems • New Highly Efficient Intermodal Operations • River • Fourth Largest Inland Port in the U.S.
Memphis Regional Megasite Workforce Market • Population Growth
Any Style of Living is Available and Affordable • Housing Cost 20% Below U.S. Average
Memphis Region Has Skilled Workers Available • For the Top Manufacturing/Technical Occupations in the Rubber Industry • Fewer Jobs Due to Recession • More Workers Available for a New Employer • Plus 16,888 Graduates from Colleges and Technical Schools Each Year • $18.60 Average Hourly Wage for • Top Rubber Manufacturing Occupations • 17.6% Lower than U.S. Average Hourly Wage • Sources: BLS, EMSI, Younger Associates
Memphis Regional Megasite Workforce Market • Higher Education • More New Technically Trained Workers Each Year • Sources: IPEDS, BLS