Download
1 / 65
650 likes | 800 Vues
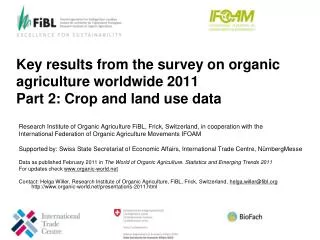
Key results from the survey on organic agriculture worldwide 2012 Part 2 : Land use and crop data. Research Institute of Organic Agriculture FiBL, Frick, Switzerland, in cooperation with the International Federation of Organic Agriculture Movements IFOAM

E N D
Key results from the survey on organic agriculture worldwide 2012Part 2: Land use and crop data Research Institute of Organic Agriculture FiBL, Frick, Switzerland, in cooperation with the International Federation of Organic Agriculture Movements IFOAM Supported by: Swiss State Secretariat of Economic Affairs, International Trade Centre, NürnbergMesse Data as published February 2012 in The World of Organic Agriculture. Statistics and Emerging Trends 2012 For updates check www.organic-world.net Contact: Helga Willer, Research Institute of Organic Agriculture, FiBL, Frick, Switzerland, helga.willer@fibl.org, http://www.organic-world.net/yearbook-2012.html FiBL, Frick, May 7, 2012
The Global Survey on Organic Agriculture: Supporters • International Trade Centre, Geneva • The Swiss State Secretariat of EconomicAffairs SECO, Berne • Nürnberg Messe, theorganizers of theBioFach Organic Trade Fair
The World of Organic Agriculture 2012 • The 13th edition of ‚The World of Organic Agriculture‘, was published by FiBL and IFOAM in February 2012.* • Contents: • Results of the survey on organic agriculture worldwide; • Organic agriculture in the regions and country reports; • Australia, Azerbaijan, Benin, Bulgaria, Canada, Ethiopia, Iran, Pacific Islands, Peru, Thailand, Turkey and United States. • Chapters on the global market, standards & legislations, voluntary standards , PGS and European market • Numerous tables and graphs. • The book can be ordered via IFOAM.org and shop.FiBL.org. *Willer, H, and Kilcher, L. (2012) The World of Organic Agriculture. Statistics and Emerging Trends 2012. IFOAM, Bonn, and FiBL, Frick
Website www.organic-world.net • Detailed statistics in excel format (in progress) • Graphs & Maps • Data revisions • News and background information
Definition of organic areas • Agricultural land (37 million hectares in 2010) • Cropland • Arable land (cereals, vegetables etc.) • Permanent crops (fruit, grapes, olives …) • Cropland, no details (=arable land and permanent crops) • Permanent grassland • Other agricultural land • Non-agricultural areas (43 million hectares) • Wild collection/Bee keeping • Forest • Aquaculture • Grazing areas on non-agricultural land
World: Use of organic agricultural land 2010 (total: 37 million hectares) Source: FiBL-IFOAM Survey 2012
Main land use types in organic agriculture 2010 • The chart of the share of land use types in the regions shows: • For a large part of the organic agricultural land in both Africa and Asia, land use information is not available • Africa has a large proportion of permanent crops; these are mainly cash crops such as coffee, tropical fruit and olives. • Europe and North America use about half of their organic agricultural land as grassland, and the other half is arable land. In Europe the share of permanent crops is higher than in North America, mainly due to olives and grapes grown in the Mediterranean countries. • Latin America has little arable land compared to the large grazing areas (Uruguay and Argentina). It has a comparatively high share of permanent crops (mainly coffee). • Oceania is characterized by the large grazing areas of Australia. The Pacific Islands produce a large range of tropical crops; New Zealand produces a lot of fruit.
Agricultural landuse by region in organicagriculture 2010 Source: FiBL & IFOAM Survey 2012
Development oflandusetypes in organicagriculture 2004-2010 Source: FiBL & IFOAM Survey 2012Figureexcludesdataforortheragriculturallandoragriculturallandforwhichno details areavailable
World: Use of organic agricultural land 2010 (total: 37 million hectares) Source: FiBL & IFOAM Survey 2012
Key crop groups in organic agriculture: 2009 and 2010 compared FiBL-IFOAM Survey 2012, based on data from governments, the private organic sector and certifiers
Organic grassland/grazing areas 2010 • With a total of at least 23.7 million hectares, the organic grassland/grazing areas constitute almost two thirds or 64 percent of the organic agricultural land. • The organic grassland/grazing areas account for 0.4 percent of the world’s total organic grassland/grazing areas . • An increase of 0.1 million hectares or 1 percent was reported compared with 2009. • Half of the organic organic grassland/grazing areas is located in Oceania (50 percent of the organic grassland/grazing area or 11.8 million hectares), followed by Latin America (24 percentor 5.6 millionhectares) and Europe 19 percentor 4.5 millionhectares). Source: FiBL & IFOAM Survey 2012
Organic permanent grassland/grazing areas by region 2010 (total 23.7 million hectares) Source: FiBL & IFOAM Survey 2012
Organic arable land 2010 • With a total of at least 6.1 million hectares, arable land constitutes 17 percent of the organic agricultural land. • The organic arable land accounts for 0.44 percent of the world’s total arable land. • An increase of 6 percent was reported. • Most of the organic arable land is located in Europe (4.1 million hectares), followed by North America (more than 1.3 million) and Latin America (412’349 hectares). • Most of this category of land is used for cereals including rice (2.5 million hectares), followed by green fodder from arable land (2 million hectares) and vegetables (0.22 millionhectares). Source: FiBL & IFOAM Survey 2012
Organic arableland by region 2010 (total 6.1 millionhectares) Source: FiBL & IFOAM Survey 2012
Organicarablelandworldwidebymaincropgroups 2010 (total 6.1 millionhectares) Source: FiBL & IFOAM Survey 2012
Permanent cropland 2010 • Permanent crops account for approximately seven percent of the organic agricultural land, amounting to 2.7 million hectares, which is 1.75 percent of the world’s permanent cropland. • Compared with the previous survey (data 2009), 0.15 million hectares more were reported. • With 7 percent, permanent cropland has a higher share in organic agriculture than in total agriculture, where it accounts for approximately three percent of the agricultural land. • Most of the permanent cropland is in Europe (almost 1 million hectares), followed by Latin America (0.87 million hectares) and Africa (0.48 million hectares). • The most important crops are coffee (with 0.64 million hectares reported, constituting 24% of the organic permanent cropland), followed by olives (0.49 million hectares), cocoa (0.29 million hectares), nuts (0.26 million hectares), and grapes (0.21 million hectares). Source: FiBL & IFOAM Survey 2012
Organic permanent cropland by region 2010 (total 2.7 millionhectares) Source: FiBL & IFOAM Survey 2012
Organic permanent cropland worldwide by main crop groups 2010 (total 2.7 million hectares) Source: FiBL & IFOAM Survey 2012
Organic wild collection and beekeeping 2010 • A collection area (including beekeeping) of 43 million hectares was reported for 2010. • The organic wild collection areas are concentrated in Africa, Asia, Europe and Latin America. • The countries with the largest areas are Finland (mainly berries), followed by Brazil and Zambia (beekeeping). • Wild berries, medicinal and aromaric plants are the main crops in this areas. • An increase of 2 million hectares were reported compared with 2009, this represent a almost 5 percent growth.
Geographical distribution of organic wild collection and beekeeping areas in 2010
Organic wild collection & beekeeping: The ten countries with the largest areas 2010
Organic wild collection and beekeeping land worldwide by main crop groups 2010 (total 43 million hectares) FiBL-IFOAM Survey 2012, based on national sources
Organic citrus fruit 2010 • The area of organic citrus fruits includes oranges, lemons and limes, grapefruit and pomelos and ‘other citrus fruits’. • At least 60’000 hectares of citrus fruit are grown organically worldwide. • This constitutes 0.7 percent of the world’s citrus area of 8.9 million hectares in 2009 (FAOSTAT). • The countries with the largest organic citrus areas are: Italy, Mexico and Ghana. • As no crop details for the organic area were available for some of the world’s leading citrus producers - China (2 millionhectares), India (0.9 millionhectares, and Nigeria (0.75 million hectares) - it can be assumed that the world figures for the area under organic citrus is higher.
Organic citrus area: The ten countries with the largest areas 2010 FiBL-IFOAM Survey 2012, based on national sources
Organic citrus fruit: Growth of the organically managed land 2004-2010 Source: FiBL, IFOAM & SOEL Surveys 2006-2012
Organic cereals 2010 • In 2010, 2.5 million hectares of cereals were under organic management. • This is an increase of 0.1 million hectares compared with 2009, when 2.4 million hectares were grown organically. • The countries with the largest organic cereal areas are the US, Canada, Germany and Italy. • As some of the world’s large cereal producers (such as India, China and the Russian Federation) did not provide land use details, it can be assumed that the area is actually larger. • 0.4 percent of the total cereal area is under organic management (according to FAO 700 million hectares of cereals were harvested in 2009). • Some countries are, however, reaching higher shares: Austria (11.4 percent), Sweden (7.4 percent), Estonia (6.1 percent) and Lithuania (5.8 percent).
Organic cereals: Growth of the organically managed land 2004-2010 FiBL-IFOAM Survey 2012, based on national sources
Organic cereals: The ten countries with the largest areas 2010 FiBL-IFOAM Survey 2012, based on national sources
Organic cereal land worldwide by main crop groups 2010 (total 2.5 million hectares) FiBL-IFOAM Survey 2012, based on national sources
Organic cocoa 2010 • Almost 290'000 hectares of organic cocoa were grown organically in 2010. • The countries with the largest cocoa area are Dominican Republic, Sierra Leone, Ecuador and Peru. • Compared with 2010, there was an increase of 25'000 hectares. • 3.3 percent of the world’s harvested cocoa bean area of 8.4 million hectares are organic. (FAOSTAT, 2009 data). • The world’s leading coca producers are Ivory Coast, Ghana, Nigeria and Indonesia. With the exception of Nigeria, data on organic cocoa area were available for all these countries.
Organic cocoa area: The ten leading countries 2010 FiBL-IFOAM Survey 2012 based on national sources
Organic cocoa: Growth of the organically managed land 2004-2010 FiBL-IFOAM Survey 2012 based on national sources
Organic coffee 2010 • More than 0.6 million hectares of coffee were grown organically in 2010. • This constitutes 6.5 percent of the world’s harvested coffee area of 9.8 million hectares (FAOSTAT, data 2009). • The world’s leading producers are Brazil (2 million hectares), Indonesia (almost 1 million hectares), Mexico (0.8 million hectares), Colombia (0.8 million hectares), and Vietnam (0.5 million hectares), for all of which data on the organic production were available. • The largest organic coffee areas are in Mexico, Peru and Ethiopia. • These countries are also reaching high shares of the total harvested coffee area: Peru: 39 percent; Ethiopia: 31 percent; Mexico 23 percent. • Compared with 2009, the organic coffee area grew by 80'000 hectares.
Organic coffee area 2010: The ten countries with the largest areas FiBL-IFOAM Survey 2012, based on national data
Organic coffee: Growth of the organically managed land 2004-2010 FiBL-IFOAM Survey 2012, based on national data
Organic temperate fruit 2010 • . Nearly 125’000 hectares of temperate fruit were recorded, representing 1 percent of the global temperate fruit area (11.9 million hectares in 2009 according to FAOSTAT). • The most important temperate growers in the world are China, Russia, Iran, India, Turkey and Serbia. Organic data was only available for onle three of this countries: Iran, Turkey and Serbia. • Since 2004, when sata on land use and crops were collected for the first time (almost 60’000 hectares) the temperate fruit area has doubled. • The countries with the highest shares on temperate fruit organic area are the Czech Republic, Austria, Slovenia and Denmark.
Organic temerpate fruit: Growth of the organically managed land 2004-2010
Organic temperate fruit land worldwide by main crop groups 2010
Organic temperate fruit: The ten countries with the largest areas 2010 FiBL-IFOAM Survey 2012, based on national sources
Tropical and Subtropical Fruit 2010 • Almost 200’000 hectares of organic tropical and subtropical area were recorded . This represent a 0.8 percent of the total area of tropical and subtropical fruit ( 23 million hectares according FAOSTAT 2009). • Of the five most important growers in the world, India, China, Uganda, Brazil and the Philippines, only the Philippines provided data on area under organic tropical and subtropical fruit grow in 2010. • The largest propotion of organic tropical and subtropical fruit are in French Polynesia (54 percent), Burkina Faso (31.5 percent, mainly mangos), followed by the Dominican Republic (20 percent, mainly bananas). • Compared with 2009, the organic tropical and subtropical fruit area grew by 15'000 hectares or 8.7 percent.
Organic tropical and subtropical: Growth of the organically managed land 2004-2010
Organic tropical and subtropical fruit land worldwide by main crop groups 2010
Organic tropical and subtropical fruit: The ten countries with the largest areas 2010 FiBL-IFOAM Survey 2012, based on national sources
Organic grape area 2010 • More than 200’000 hectares of organic grapes were grown in 2010. • The main countries in which grapes are grown are the countries of the Mediterranean, with Spain being the largest grower, followed by Italy and France. • More than three quarters of the organic grape area are in Europe. • This is approximately 2.9 percent of the world’s total harvested grape area (7.6 million hectares, FAOSTAT 2009 data). • The highest shears are in Austria (8.6 percent) followed by France and Italy (with more than 6 percent. • The organic grape area grew by 14 percent in 2010 and by almost 200 percent between 2000 and 2009.
Organic grapes: Distribution of the organic area by country 2010 Source: FiBL and IFOAM Survey 2012
Organic grapes: The ten countries with the largest areas 2010 FiBL-IFOAM Survey 2012, based on national sources
Organic grapes: The ten countries/areas with the highest shares 2010 Source: FiBL and IFOAM Survey 2011, based on national data; shares calculated with FAOSTAT data
Organic grapes: Growth of the global organicarea 2004-2010 Source: FiBLand IFOAM Survey 2012
Development of the organic grape area 2000-2010 in Spain (including in-conversion areas) Source: MARA 1999-2012