Download
1 / 41
460 likes | 1.23k Vues
Cities in the Less Developed World. Dr. Rajiv Thakur GEO 365 SP 2010. Urban Population. In more developed regions, 952 million people, or 77% of the population (of 1.23 billion) will live in urban areas by 2015 In less developed regions,

E N D
Cities in the Less Developed World Dr. Rajiv Thakur GEO 365 SP 2010
Urban Population In more developed regions, • 952 million people, or 77% of the population (of 1.23 billion) will live in urban areas by 2015 In less developed regions, • 2.9 billion people, or 48.7% of the population (of 5.97 billion) will live in urban areas by 2015 • Source: United Nations, Population Division (2004) World Urbanization Prospects: The 2003 Revisionhttp://www.un.org/esa/population/publications/wup2003/WUP2003Report.pdf • Data Tables and Highlightshttp://www.un.org/esa/population/publications/wup2003/2003WUPHighlights.pdf • Downloadable data available in the United Nations World Urbanization Prospects: The 2003 Revision Population Database. http://esa.un.org/unup
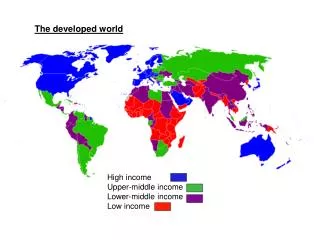
Fig. 15.1:Map of world by Pct Urban. Great variations exist among the more Urbanized countries in the developed world and the less urbanized countries in the developing world
Urbanization and Urban Growth • Urbanization: share of population that live in urban areas. It could be a result of rural-to-urban migration, etc. • Urban Growth: refers to the overall growth in the population that lives in cities. • When national population grows, cities may grown even without the real shift/migration of people from rural to urban areas. • Third world urbanization mostly comes from rural-urban migration
Who’s Urban? The pct. of urban is loosely related to the GDP per capita. Figure 15.2, p. 427, Kaplan et. Al. 2008 Developed country with high GDP / capita, LDCs with very low GDP / capita; Latin Amer. countries are highly urbanized, with 2/3rd popl. residing in cities, with the southern cone at 90%; Middle East ~ 85%; In 1950, < 1 in 6 in 3rd world lived in cities, in 2000, it is 1 in 2 lives in cities.
Urbanization Rates by Region Figure 15.3 • N. America, Europe & Japan are at saturation & hence not urbanizing any more. • Asian and African regions are still urbanizing. • In many developed countries, rate of urbanization are now declining, it dropped to 3.4% in 2000 compared to 5.2% in the 1950s. Why?? • Cities in developing countries are growing faster
1 Million or more • Cities (not MSAs0 of 1 million or more population in 2015 • In China, 98 urban agglomerations are projected to have populations of 1 million or more by 2015 • In India, 50 (India’s urban growth and natural increase in Urban areas is relatively slower than that of China) • In the US, 45 (continental USA has 49 MSAs>1m, 2000 Census) • In Brazil, 21 • Source: United Nations, Population Division (2004) World Urbanization Prospects: The 2003 Revision, pp. 262-272.http://www.un.org/esa/population/publications/wup2003/WUP2003Report.pdf
Mega-Cities in More Developed Regions Tokyo 36.2 New York 19.7 Los Angeles 12.9 Osaka-Kobe 11.4 Moscow 10.9 Paris 10.0 Mega-Cities in Less Developed Regions Mumbai 22.6 Delhi 20.9 Mexico City 20.6 Sao Paulo 20.0 Dhaka 17.9 Jakarta 17.5 Lagos 17.0 Calcutta 16.8 Karachi 16.2 Buenos Aires 14.6 Cairo 13.1 Shanghai 12.7 Manila 12.6 Rio de Janeiro 12.4 Istanbul 11.3 Beijing 11.1 Largest Cities in 2015 (in millions)[as Projected by the UN World Urbanization Prospects: 2003 Revision, p. 261]
Causes of Urban Growth • Demographic Factors • Natural increase • Birth rate minus death rate • Migration • Net migration = in-migration minus out-migration • Rural-to-urban migration (significant in South of Sahara in Africa) • For job opportunities outside the primary sector • For education for children • Primacy • Primate city as a focus for investment and for inmigration • The population of the largest city is more than twice the size of next largest city. Examples: Lagos (10 m) in Nigeria is 3 times larger that the next largest city of Kano; Mexico City (17 m) is far larger than Guadalaraja (1.6 m); etc. • Primate cities also in developed nations: Seoul in S. Korea, 25% the country’s urban population and 20% of the country’s total population.
Theories of Urbanization & DevelopmentKaplan et al. pp. 433-440 and Pacione, pp. 433-435 Theories of development and underdevelopment • Modernization Theory: • Trickle-down of growth from large to smaller cities • The developing countries are in a process of transition from preindustrial to industrial society, and are in the midst of a capitalist transformation: follows western industrial society • Cultural changes are at work, the society will soon be ‘westernized’ and will achieve a modern/developed status • Dependency Theory: colonizers and colonies • Role of Third World port cities in colonies to export natural resources • Neocolonialism = same for former • World Systems Theory- Wallerstein • Core, semi-periphery, periphery
World-System Theory • Immanuel Maurice Wallerstein • Sociologist, historical social scientist and world system analyst • Draws from • Marx • Fernand Braudel • Core-periphery • Core-Periphery Model • Globally, uneven economic development and distribution of power. • Interdependent • Core • Semi-periphery • Periphery
Contemporary Economic Landscapes • Identifying pattern • Core and Periphery (World Systems Theory!) Immanuel Wallerstein (1984) Historical - Structural relationship! • Attributes • Core • Dominant, active in world trade, rich, market type economy, primarily industrial, exporter of manufactured goods, control on capital • Periphery • Secondary/passive, in world trade, maybe market type or subsistence type, external dependence, import led economy and borrower of capital
Other characteristics • Core • Controls the most advanced technologies • High levels of productivity • Low birth rate, low death rate, low infant mortality rates • Periphery • Socio-economic inequalities • Historical experience of colonialism • Semi-periphery • exploits peripheral regions but are themselves exploited and dominated by center regions. • A mix of both sets of processes
Dependency Theory • Core-periphery relationship is problematic. • Economic exploitation of periphery • Core growth is the result of exploitation • Caused underdevelopment • Periphery can only grow by separating from global capitalistic structure • How do you extend this idea within an Urban-Rural concept? • Think about why did Southern part of Quebec province voted ‘For Separation’ while northern part voted against it?
Development Theory & Urbanization • Rostow’s stages of economic growth • Assumes that poverty and lack of development are the problems • Also assumes that poor countries need to emulate Western growth
New International Division of Labor • Factories of multinational corporations (MNCs) are located where urban infrastructure permits global connections • Often in primate cities of Third World countries • Cheap labor made possible by rural-to-urban migration • Technology allows the separation of production from management • Satellites, computers, containers
Vance’s Mercantile Model of Urban Developmentin ColoniesFigure 15.6Examples from IndiaMost port cities connected by railwaysIron, coal, gold, silver, Aluminum, zinc, etc. in interiors connected by railways initially. Most of today’s third world cities were established as port cities/urban centers during colonial era on roads, railways, etc that served as export/import centers to serve their colonizersMost development occurred after independence
Characteristics of Third World Cities: Slums formed from overcrowding of low paid folks Slum opposite of Bandra Railway Station, Mumbai, India
School Children walk to their shanty homes in Kenya They live 10 to a room Slums Housing on the approach to Delhi by train
POVERTY - INEQUALITY & GENDER • Poverty • Illiteracy, destitution, 100s of millions • Kolkata – 700,00 homeless • Shantytowns / Bustees • Informal Economic Sector(90% production by women ) • 45 % of India’s population with Income < $1/day(UNDF) • 390 millions with Income < $1 per week
Planet of Slums[The title of a book by Mike Davis, 2006] • A slum is characterized by overcrowding, poor or informal housing, inadequate access to safe water and sanitation, and insecurity of tenure. • Includes peripheral shantytowns as well as inner-city tenements • “Bombay, with 10 to 12 million squatters and tenement-dwellers, is the global capital of slum-dwelling, followed by Mexico City and Dhaka (9 to 10 million each), and then Lagos, Cairo, Karachi, Kishasa-Brazzaville, Sao Paulo, Shanghai, and Delhi (6 to 8 million each).” • Source: M. Davis, Planet of Slums. London: Verso, 2006, p. 23 • http://video.google.com/videoplay?docid=2667819423771127127&q=slums
10 Most Populated MSAs in India (2009 Estimated Population Based on 2001 Census Count)
Some Famous Slum EvictionsSource: Mike Davis, Planet of Slums, p. 102 Year City Number evicted 1976 Mumbai 70,000 • Seoul 800,000 • Lagos 300,000 • Rangoon 1,000,000 • Beijing 100,000 2001-03 Jakarta 500,000 2005 Harare 750,000
Third World Slums and Squatter Settlements • Slums form at edges of cities, not in the center • No infrastructure is provided (water, utilities, sanitation • Pirated electricity • Small formal sector, so large numbers unemployed or, at best, in the informal sector • “We prefer child labour. Children work faster, work longer hours and are more dependable; they also do not form unions or take time off for tea and cigarettes.” (Pacione, Box 26.3, p. 525)
Where the Poor LiveSource: Mike Davis, Planet of Slums, p. 31 Inner-city slums Peripheral slums • Karachi 34% 66% • Khartoum 17% 83% • Lusaka 34% 66% • Mexico City 27% 73% • Mumbai 20% 80% • Rio de Janeiro 23% 77%
Health Risks in Third World CitiesBased on Pacione, Table 27.1 (pp. 546-549) • Contaminated water • Inadequate disposal of human wastes • Wastewater and garbage • Insects, pests (e.g. rats) and parasites in homes • Inadequate-sized houses, poor ventilation and overcrowding • Children at risk from traffic, unsafe or contaminated sites • Indoor air pollution • House sites vulnerable to landslides or floods • Nutritional deficiencies • No or inadequate health care and advice • No emergency services
Making a Living: Urban Livelihood Strategies in the Informal SectorTable 15.3
The Informal Sector in African, Latin American, and Asian CitiesTable 15.4 End!!
Entrepreneurs in the Two Circuits • There is a significant difference between entrepreneurs who have an education and who have contacts with markets elsewhere and, on the other hand, entrepreneurs who rely only on the local market and on passers-by • Entrepreneurship or self-employment can be a sign of poverty, not of success • E.g. street food vendors: “Profit is not the only thing. It is everything.” (Fass 1995, p. 1569) • Sources: Fass, Murphy, Tambunan
More than 50% illegal Addis Ababa 85% Jakarta 62% Dar es Salaam 60% Bogata 59% Cairo 54% Ankara 51% 30-50% of housing illegal Karachi 50% Lusaka 50% Mexico City 50% Manila 40% Delhi 40% Caracas 34% Lima 33% Sao Paulo 32% Illegal Housing in Third World CitiesBased on Pacione, Table 25.4