AMEN Suite: Advanced Tools for Molecular Systems Biology Data Analysis
10 likes | 111 Vues
The AMEN suite, developed by Frédéric Chalmel and Michael Primig, is a modern software architecture designed for analyzing large biological datasets generated from high-throughput genome experiments. With a user-friendly interface and robust modules, AMEN facilitates data uploading, preprocessing, and analysis through its four-layer architecture. It effectively manages expression, annotation, mapping, and interaction data, allowing life scientists to explore complex biological processes. AMEN is freely available under the GNU license and supports simultaneous visualization of various data types, enhancing interpretative capabilities.

AMEN Suite: Advanced Tools for Molecular Systems Biology Data Analysis
E N D
Presentation Transcript
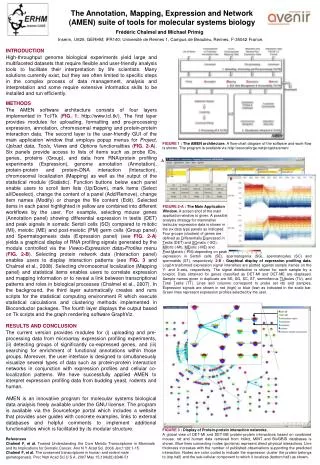
The Annotation, Mapping, Expression and Network (AMEN) suite of tools for molecular systems biology Frédéric Chalmeland Michael Primig Inserm, U625, GERHM; IFR140; Université de Rennes 1, Campus de Beaulieu, Rennes, F-35042 France. INTRODUCTION High-throughput genome biological experiments yield large and multifaceted datasets that require flexible and user-friendly analysis tools to facilitate their interpretation by life scientists. Many solutions currently exist, but they are often limited to specific steps in the complex process of data management, analysis and interpretation and some require extensive informatics skills to be installed and run efficiently. METHODS The AMEN software architecture consists of four layers implemented in Tcl/Tk (FIG. 1; http://www.tcl.tk/). The first layer provides modules for uploading, formatting and pre-processing expression, annotation, chromosomal mapping and protein-protein interaction data. The second layer is the user-friendly GUI of the main application window that employs popup menus for Project, Uploaddata, Tools, Views and Options functionalities (FIG. 2-A). Six panels provide access to lists of items such as probe IDs, genes, proteins (Group), and data from RNA/protein profiling experiments (Expression), genome annotation (Annotation), protein-protein and protein-DNA interaction (Interaction), chromosomal localization (Mapping) as well as the output of the statistical module (Statistic). Function buttons below each panel enable users to scroll item lists (Up/Down), mark items (Select all/Deselect), change the content of a panel (Add/Remove), change item names (Modify) or change the file content (Edit). Selected items in each panel highlighted in yellow are combined into different workflows by the user. For example, selecting mouse genes (Annotation panel) showing differential expression in testis (DET) and peak signals in somatic Sertoli cells (SO) compared to mitotic (MI), meiotic (ME) and post-meiotic (PM) germ cells (Group panel) and Spermatogenesis data (Expression panel) (see FIG. 2-A) yields a graphical display of RNA profiling signals generated by the module controlled via the Views>Expression data>Profiles menu (FIG. 2-B). Selecting protein network data (Interaction panel) enables users to display interaction patterns (see FIG. 3 and Chalmel et al., 2008). Selecting chromosomal localization (Mapping panel) and statistical items enables users to correlate expression and mapping information or to reveal a link between transcriptional patterns and roles in biological processes (Chalmel et al., 2007). In the background, the third layer automatically creates and runs scripts for the statistical computing environment R which execute statistical calculations and clustering methods implemented in Bioconductor packages. The fourth layer displays the output based on Tk scripts and the graph rendering software GraphViz. FIGURE 1 : The AMEN architecture.A flow-chart diagram of the software and work-flow is shown. The program is available via http://sourceforge.net/projects/amen/ A B FIGURE 2-A : The Main Application Window.A screen shot of the main application window is given. A possible analysis strategy for mammalian testicular expression data is shown in the six data type panels as indicated. Four groups (clusters) of genes are defined as Differentially Expressed in Testis (DET) and SOmatic (-SO), MItotic (-MI), MEiotic (-ME) and Post-Meiotic (-PM) depending on peak expression in Sertoli cells (SE), spermatogonia (SG), spermatocytes (SC) and spermatids (ST), respectively. 2-B : Graphical display of expression profiling data.Log2-transformed expression signal intensities are plotted against sample names on the Y- and X-axis, respectively. The signal distribution is shown for each sample by a boxplot. Data obtained for genes classified as DET-MI and DET-ME are displayed. Sample names given in duplicate are SE, SG, SC, ST, seminiferous TUbules (TU), and Total Testis (TT). Lines and columns correspond to probe set ids and samples. Expression signals are shown in red (high) or blue (low) as indicated in the scale bar. Green lines represent expression profiles selected by the user. RESULTS AND CONCLUSION The current version provides modules for (i) uploading and pre-processing data from microarray expression profiling experiments, (ii) detecting groups of significantly co-expressed genes, and (iii) searching for enrichment of functional annotations within those groups. Moreover, the user interface is designed to simultaneously visualize several types of data such as protein-protein interaction networks in conjunction with expression profiles and cellular co-localization patterns. We have successfully applied AMEN to interpret expression profiling data from budding yeast, rodents and human. AMEN is an innovative program for molecular systems biological data analysis freely available under the GNU license. The program is available via the Sourceforge portal which includes a website that provides user guides with concrete examples, links to external databases and helpful comments to implement additional functionalities which is facilitated by its modular structure. FIGURE 3 : Display of Protein-protein interaction networks. A global view of DET-MI and DET-ME protein-protein interactions based on combined mouse, rat and human data retrieved from IntAct, MINT and BioGRID databases is shown. Blue lines connecting nodes (proteins) represent direct physical interactions. Line thickness increases with the number of published observations supporting the predicted interaction. Nodes are color coded to indicate the expression cluster the protein belongs to (top half) and the sub-cellular component to which it localizes (bottom half) as shown. References Chalmel F, et al. Toward Understanding the Core Meiotic Transcriptome in Mammals and Its Implications for Somatic Cancer. Ann N Y Acad Sci. 2008 Jan;1120:1-15 Chalmel F, et al. The conserved transcriptome in human and rodent male gametogenesis. Proc Natl Acad Sci U S A. 2007 May 15;104(20):8346-51