Potential Vorticity (PV) as a Tool in Forecasting
290 likes | 677 Vues
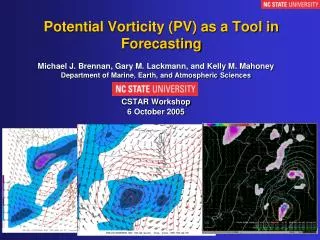
Michael J. Brennan, Gary M. Lackmann, and Kelly M. Mahoney Department of Marine, Earth, and Atmospheric Sciences CSTAR Workshop 6 October 2005. Potential Vorticity (PV) as a Tool in Forecasting. PV in Forecasting.

Potential Vorticity (PV) as a Tool in Forecasting
E N D
Presentation Transcript
Michael J. Brennan, Gary M. Lackmann, and Kelly M. Mahoney Department of Marine, Earth, and Atmospheric Sciences CSTAR Workshop 6 October 2005 Potential Vorticity (PV) as a Tool in Forecasting
PV in Forecasting • Initial attempts to integrate PV into the forecast process focused on upper-tropospheric dynamics and jet streaks • These features can be easily understood using “traditional” tools like pressure level maps/analyses, QG diagnostics, etc. • We advocate using PV to understand and track the impact of latent heating in the lower- and mid-troposphere • Not as easily seen in traditional framework • To take full advantage of this, forecasters need to be familiar with the PV framework • Extratropical cyclone structure in terms of PV • Impact of latent heating on PV distribution
Why should Forecasters use PV? • PV not conserved in the presence of latent heating • PV useful to identify features driven by latent heating (e.g., convective scheme activity) in NWP models • Model QPF low predictability relative to other parameters • QPF errors feed back to dynamics via latent heating model forecast sensitive to accuracy of upstream QPF • PV provides forecasters a means with which forecasters can • Track impacts of latent heating in real atmosphere and model forecasts • Identify situations where model guidance can be adjusted when latent heating has been misrepresented due to poor model QPF
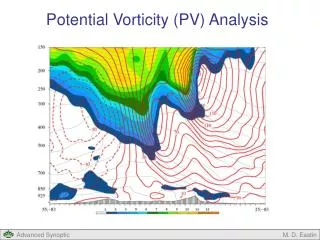
Potential Vorticity • PV is the product of the • Absolute vorticity • Static stability • High values of PV associated with • Cyclonic flow • High static stability • Low tropopause • Upper trough • Low values of PV associated with • Anticyclonic flow • Low static stability • High tropopause • Upper ridge Figures from Thorpe (1985) for Northern Hemisphere
Principles of PV Thinking • Conservation Principle • PV conserved for adiabatic, frictionless flow (Hoskins et al. 1985) PV NOT conserved for diabatic processes, like latent heating! • Invertibility Principle • PV can be inverted to recover balanced meteorological fields (height, wind, etc., Hoskins et al. 1985, Davis and Emanuel 1991) • Links synoptic and dynamic meteorology • Allows one to quantify impact of specific PV feature on rest of atmosphere
Cyclones and PV • Cyclogenesis is viewed as mutual amplification of PV anomalies on the upper and lower boundaries Upper boundary anomaly Circulation induced at upper boundary Circulation induced at lower boundary Lower boundary anomaly Hoskins et al., (1985) • Upper-level anomaly’s imparts circulation at the surface • Positive anomaly forms there its circulation reaches to the tropopause • Circulation from one anomaly amplifies the other
PV and Latent Heating • PV generated below level of maximum heating • Warming increases static stability • Pressure falls convergence increases absolute vorticity PV- PV+ • Opposite occurs above level of maximum heating where PV is reduced • PV growth rate determined by vertical gradient of LHR
PV and Latent Heating • In the presence of vertical wind shear the PV redistribution occurs along the absolute vorticity vector (Raymond 1992) –PV Q +PV Raymond (1992)
The whole picture Upper-level diabatic minimum Upper-Level maximum Surface warm anomaly Diabatic lower-tropospheric maximum Reed et al. (1992)
Major PV features in a mature extratropical cyclone • And their counterparts in the traditional QG framework • Upper-tropospheric PV maximum • Upper trough 2. Surface θ maximum • Surface cyclone 3. Lower-tropospheric diabatic PV maximum • Height (pressure) falls due to latent heating 4. Upper-tropospheric diabatic PV minimum • Downstream ridging aloft due to latent heating
Case Studies • Diabatic PV maxima in the lower-troposphere can impact • Extratropical cyclones • Low-level jets • Moisture transport • Moisture transport in extratropical cyclones • 24–25 January 2000 2. Low-level jet enhancement in high-wind event • 1 December 2004 3. Coastal extratropical cyclogenesis • 17 February 2004
Moisture Transport • Diabatic PV maxima in lower-troposphere alter flow in region of high moisture content, impacting moisture transport • Extratropical cyclones (e.g., Whitaker et al. 1988, Brennan and Lackmann 2005) • Along cold fronts (e.g., Lackmann 2002) • Pineapple Express events (e.g., Lackmann and Gyakum 1999) • In Jan. 2000 case, precipitation early on 24 Jan. generated lower-tropospheric PV maximum • Precipitation was unforecasted by Eta model • Eta failed to generate PV maximum and inland moisture transport into region of heavy snowfall
24–25 Jan. 2000 • Compare model analysis to 24-h Eta forecast at 00 UTC 25 January 2000 1.5 PVU maximum Significant inland moisture flux No PV maximum Weak/no moisture flux RUC Analysis 900–700 mb PV, 700-mb moisture flux, 700-mb wind 24-h Eta Forecast 900–700 mb PV, 700-mb moisture flux, 700-mb wind
Jan. 2000 Snowstorm Case • Model failure to capture latent heating with IP IP feature apparent in lower-tropospheric PV • Comparing model PV forecast to analyses could increase forecasters’ recognition of consequences of unforecasted latent heating • Lower-tropospheric moisture transport feedbacks may be common to major model QPF failures
Low-Level Jets • Diabatic PV maxima can significantly strengthen low-level jets impacting transport of high momentum air to surface • Case of 1 Dec 2004 • Strong low-level jet developed over the eastern US • 12Z IAD sounding > 90 kt winds near 800 mb • Widespread wind damage from Mid-Atlantic to New England • 2 fatalities, 5 injuries, $1.5 million in property damage (NCDC)
Radar and 900–700 mb PV 2-km NOWRAD and RUC analysis 09 UTC 2-km NOWRAD and RUC analysis 12 UTC • 1.25 PVU maximum develops along in wake of precipitation shield over Mid-Atlantic
900–700-mb PV and Low-Level Jet • Low-level jet strengthens to 70+ kt. on eastern flank of PV maximum • Cyclonic circulation associated with PV maximum likely contributed to strength of jet • Contribution can be as much as 40% (Lackmann 2002) RUC analysis 09 UTC 900–700-mb PV 850-mb wind and isotachs (kt) RUC analysis 12 UTC 900–700-mb PV 850-mb wind and isotachs (kt)
LLJ Case • Plotting 900–700-mb layer PV indicated presence of diabatically enhanced LLJ • Real-time evaluation of model QPF and PV could allow anticipation of over/underestimate of LLJ enhancement • Separate question: To what extent will LLJ winds mix to surface??
Coastal Cyclogenesis • 17 February 2004 • Real-time awareness that cyclogenesis in Eta model was tied to convective precipitation • Sensitivity tested by running Workstation Eta model varying CP scheme (Betts-Miller-Janjić and Kain-Fritsch) • Initialized at same time with identical model configuration • Results show very different cyclone evolution and precipitation patterns
Workstation Eta Forecasts 900–700-mb PV Sea-level pressureConvective Precip • 3 convective precip maxima • 3 PV maxima • 3 surface lows • 1 continuous convective precip. maximum • Broad surface low BMJ CP Scheme KF CP Scheme • Convective precipitation generates low-level PV maxima and surface low centers offshore • 3 low centers in BMJ run one with each area of convective precipitation • 1 low center in KF run continuous line of convective precipitation
Coastal Cyclogenesis • Plotting 900–700-mb layer PV with convective precipitation identified SLP minima linked to CP scheme activity • With all due respect to CP schemes, these features should be interpreted as having a lower level of certainty
Conclusions • PV can be utilized by operational forecasters to track impact of latent heating in real atmosphere and NWP models • PV thinking can be used to adjust model guidance in cases of misrepresented latent heating • Lower-tropospheric PV maxima provide a means to recognize the impact of latent heating on • Moisture transport • Cyclogenesis • Low-level jets
Forecasting Tools • Evaluate model performance: • Compare model QPF to observations, radar, and satellite to look for areas of misplaced or erroneous latent heating • Compare diabatially generated PV features in model forecasts to high-frequency analyses • Use PV thinkingtoadjust model guidance by understanding impact of latent heating on moisture transport, cyclogenesis, low-level jets AWIPS Procedure (developed at NWS Raleigh) Overlay QPF (total and/or convective) Lower-tropospheric PV and wind Sea level pressure
Acknowledgements • CSTAR Grants NA-07WA0206 and NA03NWS4680007 • NCEP provided Workstation Eta model and initial condition data for Feb. 17 2004 case simulations • Jonathan Blaes of NWS Raleigh assisted with AWIPS procedure development • Much of meteorological data provided by Unidata
References Brennan, M. J., and G. M. Lackmann, 2005: The influence of incipient latent heat release on the precipitation distribution of the 2425 January 2000 cyclone. Mon. Wea. Rev.,133, 1913-1937 Davis, C. A., and K. A. Emanuel, 1991: Potential vorticity diagnostics of cyclogenesis. Mon. Wea. Rev.,119, 19291953. Hoskins, B. J., M. E. McIntyre, and A. W. Robertson, 1985: On the use and significance of isentropic potential vorticity maps. Quart. J. Roy. Meteor. Soc.,111, 877946. Lackmann, G. M., 2002: Cold-frontal potential vorticity maxima, the low-level Jet, and moisture transport in extratropical cyclones.Mon. Wea. Rev.,130, 59–74. Lackmann, G. M., and J. G. Gyakum, 1999: Heavy cold-season precipitation in the northwestern United States: Synoptic climatology and an analysis of the flood of 1718 January 1986. Wea. Forecasting,14, 687700. Raymond, D. J., 1992: Nonlinear balance and potential-vorticity thinking at large Rossby number. Quart. J. Roy. Meteor. Soc.,118, 9871015. Reed, R. J., M. T. Stoelinga, and Y.-H. Kuo, 1992: A model-based study of the origin and evolution of the anomalously high potential vorticity in the inner region of a rapidly deepening marine cyclone. Mon. Wea. Rev.,120, 893913. Thorpe, A. J., 1985. Potential vorticity and the structure of tropical cyclones. 16th Conf. on Hurricanes and Tropical Meteorology, Amer. Meteor. Soc., 113114. Whitaker, J. S., L. W. Uccellini, and K. F. Brill, 1988: A model-based diagnostic study of the rapid development phase of the Presidents’ Day cyclone. Mon. Wea. Rev., 116, 2337–2365.