Overview of Cigarette Smoking Prevalence and Cessation Efforts Among English Adults
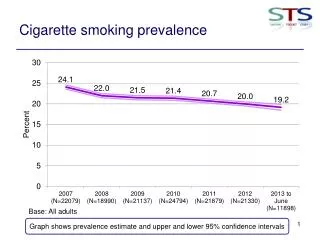
This report provides insights into cigarette smoking prevalence among all adults in England, highlighting estimates and confidence intervals. It details the decrease in smoking prevalence, the percentage of adults who stopped smoking in the past year, and the attempts to quit among current smokers. Success rates for those who tried to quit are also analyzed. Data was collected through monthly household surveys of approximately 1800 adults (16+ years old) in England, conducted by TNS/BMRB and later by IPSOS MORI. For more information, visit www.smokinginengland.info.

Overview of Cigarette Smoking Prevalence and Cessation Efforts Among English Adults
E N D
Presentation Transcript
Cigarette smoking prevalence Base: All adults Graph shows prevalence estimate and upper and lower 95% confidence intervals
Decrease in smoking prevalence Base: All adults
Stopped smoking in past 12 months Base: Adults who smoked in the past year Graph shows prevalence estimate and upper and lower 95% confidence intervals
Tried to stop smoking in past year Base: Adults who smoked in the past year Graph shows prevalence estimate and upper and lower 95% confidence intervals
Success rate for stopping in those who tried Base: Smokers who tried to stop n the past year Graph shows prevalence estimate and upper and lower 95% confidence intervals
Methods • Monthly household surveys of representative samples of approximately 1800 adults (16+ years old) in England • Fieldwork carried by TNS/BMRB up to April 2013, then IPSOS MORI. • Sample weighted to match census • Further details: www.smokinginengland.info