Download
1 / 39
390 likes | 503 Vues
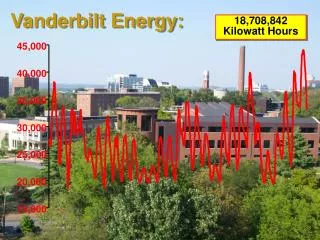
Advanced Energy Retrofit (AER) Projects Presented by: Ke Xu, Ph.D., BEMP, BEAP Sept, 25 th , 2013. Energy Efficient Buildings- Hub ( http://www.eebhub.org/ ). 5-year project mainly funded by U.S. Department of Energy (DOE) on Feb, 2011;

E N D
Advanced Energy Retrofit (AER) ProjectsPresented by: Ke Xu, Ph.D., BEMP, BEAPSept, 25th, 2013
Energy Efficient Buildings- Hub (http://www.eebhub.org/) • 5-year project mainly funded by U.S. Department of Energy (DOE) on Feb, 2011; • Now headquartered in Bldg101, Philadelphia’s Navy Yard, will move to Bldg661 in 2014; • Led by Penn State and consisted of 22 performer organizations; • Focus on improving existing small to medium sized commercial building (<250,000 SF) energy efficiency.
Outlines • Introduction: U.S. commercial building sector energy use • Retrofit project process • Concept of “Advanced Energy Retrofit” (AER) projects • AER projects in different stages • Lessons learnt and discussion
Introduction: U.S. Building Energy Use Buildings in U.S. consume 40% of primary energy, 68% of Electricity, responsible for 38% of Green House Gas (GHG) emission. Residential Building & Commercial Building EEB-Hub’s Focus
Building Retrofit Process Building Life- Cycle Retrofit Project Process
Advanced Energy Retrofit (AER) Projects • Motivated by Hub-Task members’ desires of demonstrating/testing the deployment of their tools, technologies and research results in real building retrofit projects; • Test “Integrated Design Process” in small to medium sized commercial building retrofit projects; • For whole building retrofit projects, the goal is to demonstrate 30% measurable energy reduction is achievable through Hub recommended, cost-effective ECMs; • Collect/Analyze data for retrofit projects; • How to recruit buildings?
AER Projects- recruit buildings • Request for Information (RFI) was released in Oct, 2012 soliciting building owners, facility managers, service providers, and engineering firms in Philadelphia 10 county region to consider engage Hub in their retrofit projects; • 69 inquires were received by end of Jan, 2013, 45 buildings were provided; • Visited15 buildings; • Other Hub connections: buildings in Philadelphia’s Navy Yard, Liberty Property Trust, Kaiserman, Wawa Inc.
Hub Energy Audit • Equivalent to ASHRAE Level-I energy audit; • 2-3 hours building tour; • Interview with building operators/facility managers; • Perform utility data/time series data analysis; • Tested Hub developed Energy Audit Tool.
Energy Audit- SEPTA 69th Street Station Mechanical Room North Located in Philadelphia, PA; Mixed use as transportation terminal, offices and retail stores; 50,000 GSF; 2- story with full basement; Built in 1907, renovated in 1986; Interior lighting is mixed of T- 8/12 florescent lamps, CFL, LED lights (recently updated), and High Pressure Sodium (HPS) lights; Building is heated and partially air conditioned; 2 oil-fired boilers (2*4,184 MBH, #2 heating oil is used as heating fuel) for heating; 2 water-cooled chillers (total of 80 tons) and several air-cooled split units provide cooling; Constant-speed pumps for distribution systems; Main Terminal Building Skylight (exterior glazing) Skylight seen from inside of the waiting hall Rock wool insulation on top of Hall’s ceiling
Energy Audit- SEPTA 69th Street Station Utility Bill Analysis
Energy Audit- SEPTA 69th Street Station Time-Series Data Analysis Half- hour interval electric meter data from utility company is provided by SEPTA; The building electricity usage has very high base load on hourly basis with very limited seasonal variations- about 190±40 KWh per hour, which means there is a large fraction of constant loads that are on almost 24/7 all the times. They could be interior lighting, equipment and ventilation; The building consumes about 4000 KWh a day during the transition seasons and there is no different day types- indicating the building is used 7 days a week without significant difference between weekdays and weekends;
The whole building elec. hourly use sudden drops in the morning and increases in the evening during the transition season suggest bldg. exterior lighting power usage.
Potential Energy Saving Opportunities • Replace the existing oil-fired steam boilers (approaching their end-of-life) with properly sized, modular, gas-fired, hot water boilers- this will at least save half of the heating energy cost (about $42,400 a year) just by switching the fuels, detailed quotes about new boilers need to be further investigated; • Convert the constant volume hot and chilled water distribution systems to variable volume distribution system (add VFDs); • Replace the existing, never-functioning Honeywell control system to DDC controls. Program optimal control algorithms for the boilers and the chillers; • Lighting retrofits- replace existing T-12 florescent lamps with LEDs, etc.
Install Monitoring System and Collect Baseline Building Operation Data • Sub-metering end uses; • Better understand building operations and thermal comfort/indoor air quality levels; • Calibrate building energy models; • For future M&V purposes; • Upon other investigators’ requests.
One Montgomery Plaza (1MP) Office building in Norristown, PA; Two towers (10 floors & 8 floors) and 2 levels of garages; Built in 1973, renovated in 2003; Conditioned area is about 226,000 SF; 2 dual-duct air systems; 2* 450 ton Trane centrifugal chillers; 2* 2,642 MBH gas-fired boilers; VFDs on all fans and pumps;
Use Calibrated Building EnergyPlus Model to Predict ECM savings DesignBuilder- EnergyPlus is selected as modeling tool; Model will be calibrated using the monitored operational variables to reflect “as-operated” conditions; After the modeling results show a good match to sub-metered energy use, the model can be used for ECM savings prediction;
Retrofit Execution Phase Building 101 (retrofit started Jan, 2013, commissioning ends in March) Building 661 (project under construction now) Future EEB-Hub HQ; 36,500SF; Used to serve as a “gym” for the Navy, abandoned for 20+ years; Went through an “Integrated Design Process”; Both E+ and eQuest models are built to evaluate design alternatives; Designed for 40% energy reduction compared to ASHRAE 90.1-2007; Expect to see annual site EUI around 40 kbtu/SF-yr. • 75,000 GSF, 61,000 SF conditioned space; • Multi-tenant office building; • Current Hub HQ located in Suite 210; • M & V system installed in beginning of 2012; • BAS was updated (replace old Honeywell system with ALC controllers) in Jan, 2013; • Better control algorithms were implemented.
Measurement and Verification (M&V) Phase • Does retrofit achieve the expected energy saving goals? • ASHRAE Guideline 14, International Performance. Measurement & Verification Protocol (IPMVP) defines approaches/methods to determine energy savings calculation; • Inverse (data driven) model based approach, model inputs typically include pre- & post- retrofit utility bills and outdoor air temperatures;
M & V for LPT Buildings Building #1 Building #2
Conventional M&V Method to Determine Whole Building Energy Savings • Lighting System: a sophisticated light control system is added to each building to allow automatic daylight harvest and occupancy based light on/off control. The dimmable ballast is added to each T-8 florescent lamps in the office area and light level sensors are attached to the ceiling. The occupancy sensors are also installed to the spaces. Occupants are given the freedom to adjust the light level in their offices. • HVAC System: a variable frequency drive (VFD) is added to the exhaust fan in each RTU. The RTU supply air temperature reset schedule and duct static pressure reset control algorithms are programmed into the building automation systems (BAS). CO2 sensors are placed in several critical zones in each building to facilitate demand control ventilation (DCV) capability. • Building Control System & Smart Meters: Honeywell Tridium JACE controllers are positioned to integrate the existing building BAS system (Trane), newly installed lighting control systems and power meters. Building #1 Building #2
Impact of Lighting Retrofit Building #1
LPT Buildings Savings Breakdown Building #1 (saves 11% of annual energy use) Building #2 (saves 14% of annual energy use) Note: Lighting- lighting related retrofits including day lighting harvest, occupancy sensor based control, etc.; DCV- Demand Control Ventilation; DSP- Duct Static Pressure Reset; SAT Reset- Supply Air Temperature Reset;
M & V for Bldg101 In 2012, the building consumed 987,960 KWh of electricity and 18,397 CCF of natural gas. The calculated averaging electricity price is about 14.7 cents/KWh and the gas costs about $1.35/CCF based on utility data. For 2012, this building had an EnergyStar Portfolio Manager score of 45, and it increased to 60 for the period of Aug, 1st, 2012~ July, 31st, 2013.
M & V for Bldg101- Exterior Lighting • ECM: schedule based control photo sensor based control
Lessons Learnt • Thermal comfort & IAQ issues; • Importance of field measured data; • Understand the real building operation; • Difficulty of data collection during energy audit process; • How to properly assess energy savings?- Is it a fair comparison?
Thanks! ?? Credit goes to my colleagues from Purdue University, UTRC and Penn State