Download
1 / 30
300 likes | 395 Vues
College of Arts & Sciences: 21 departments and schools 13 interdisciplinary programs 2013-14 Fact Book: 7160 UG majors 1360 G students 340,000 UG SCH (60% of UTK total) 460 T/TT faculty members 190 non-TT faculty members

E N D
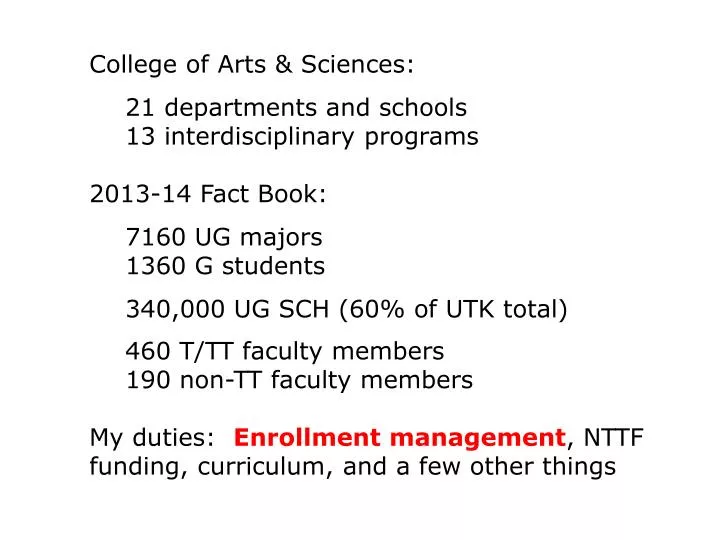
College of Arts & Sciences: 21 departments and schools 13 interdisciplinary programs 2013-14 Fact Book: 7160 UG majors 1360 G students 340,000 UG SCH (60% of UTK total) 460 T/TT faculty members 190 non-TT faculty members My duties: Enrollment management, NTTF funding, curriculum, and a few other things
Chemistry:Studying matter and its transformations at the molecular level . . . Suri and Glorius, Org. Synth. (2014)
Efficiency in chemical synthesis:Minimize cost of starting materials? Minimize number of steps? Minimize time to completion? Suri and Glorius, Org. Synth. (2014)
Efficiency in chemical synthesis:Minimize cost of starting materials? Minimize number of steps? Minimize time to completion? Data! Suri and Glorius, Org. Synth. (2014)
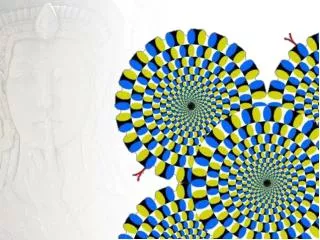
Efficiency in chemical synthesis:Minimize cost of starting materials? Minimize number of steps? Minimize time to completion? As chemistry became a quantitative disci-pline, chemists began to understand that some efforts were unproductive . . . Lead Gold Data!
Efficiency in chemical synthesis:Minimize cost of starting materials? Minimize number of steps? Minimize time to completion? As chemistry became a quantitative disci-pline, chemists began to understand that some efforts were unproductive . . . Lead Gold Wait a minute! Is this CHEM 120 or the ALR? Data!
First-time freshmen Well-educated college graduates preparedto be responsible global citizens + Transfer students + $$$
External stakeholders’ view First-time freshmen Well-educated college graduates preparedto be responsible global citizens + Transfer students + $$$
Associate dean’s view CHEM 120 MATH141 HIST 261 CHEM 369 First-time freshmen Well-educated college graduates preparedto be responsible global citizens + ENGL 118 HIST 242 ARTA 342 MATH113 Transfer students FREN 223 HIST 373 PHIL 120 MATH117 + GEOG 131 MUCO 120 MATH141 SPAN 300 $$$
GTAs lab rooms consumables CHEM 120 MATH141 HIST 261 CHEM 369 First-time freshmen Well-educated college graduates preparedto be responsible global citizens + ENGL 118 HIST 242 ARTA 342 MATH113 Transfer students FREN 223 HIST 373 PHIL 120 MATH117 + GEOG 131 MUCO 120 MATH141 SPAN 300 $$$ instructors timesof day classrooms
GTAs lab rooms consumables How to measure efficiency? Implies a choiceof quantitative metric(s). . . Cost per student credit hour? Mean time to degree? First-year retention rate? Mean class size? Mean fill rate of classrooms? Number of repeated courses? CHEM 120 MATH141 HIST 261 CHEM 369 First-time freshmen Well-educated college graduates preparedto be responsible global citizens + ENGL 118 HIST 242 ARTA 342 MATH113 Transfer students FREN 223 HIST 373 PHIL 120 MATH117 + GEOG 131 MUCO 120 MATH141 SPAN 300 $$$ instructors timesof day classrooms
GTAs lab rooms consumables But also must measure effectiveness! Learning outcomes assessment Retention and graduation rates Undergraduate research & creative activity Early contact with TT faculty Study abroad, service learning, etc. Other measures? CHEM 120 MATH141 HIST 261 CHEM 369 First-time freshmen Well-educated college graduates preparedto be responsible global citizens + ENGL 118 HIST 242 ARTA 342 MATH113 Transfer students FREN 223 HIST 373 PHIL 120 MATH117 + GEOG 131 MUCO 120 MATH141 SPAN 300 $$$ instructors timesof day classrooms
Multiple claims on resources, and a diverse set of performance metrics: Data Priorities Policies
College of Arts & Sciences: 21 departments and schools 13 interdisciplinary programs 2013-14 Fact Book: 7160 UG majors 1360 G students 340,000 UG SCH (60% of UTK total) 460 T/TT faculty members 190 non-TT faculty members Large and decentralized. So as a chemist,I give in to my reductionist tendencies . . .
Courses taken by first-time first-year students: 30 courses in Arts & Sciences account for 2/3 of all Fall semester student credit hours attempted by first-time first-year students. ENGL 101 PSYC 110 CHEM 120 BIOL 101 MATH 119 MATH 141 BIOL 130 . . .
Courses taken by first-time first-year students: 30 courses in Arts & Sciences account for 2/3 of all Fall semester student credit hours attempted by first-time first-year students. ENGL 101 PSYC 110 CHEM 120 BIOL 101 MATH 119 MATH 141 BIOL 130 . . . How can we accommodatean increase in the size ofthe first-year class from4270 to 4700?(a 10.1% increase)
The problem is still too big. Look at 100-level MATH courses taken by first-time first-year students. Fall 2013: 12 courses 3370 FT FY students (79% of FT FY class) 6340 enrollments (all students) Gateway courses for many majors More manageable . . .
Simplest possible approach: Assume the FT FY enrollments in each class will increase by 10.1%. Fall 2013, MATH 113 = 336FT FY students 320 other students Fall 2014, MATH 113 prediction: 374FT FY students 320 other students 694 total
Simplest possible approach: Assume the FT FY enrollments in each class will increase by 10.1%. Fall 2013, MATH 113 = 336FT FY students 320 other students Fall 2014, MATH 113 prediction: 374FT FY students 320 other students Fall 2014, MATH 113 actual: 377 FT FY students 346 other students 694 total 723 total
Hmmm . . . Try again? Fall 2013, MATH 115 = 219 FT FY students 512 other students Fall 2014, MATH 115 prediction: 244FT FY students 512 other students 756 total
Hmmm . . . Try again? Fall 2013, MATH 115 = 219 FT FY students 512 other students Fall 2014, MATH 115 prediction: 244FT FY students 512 other students Fall 2014, MATH 115 actual: 202 FT FY students 506 other students 756 total 708 total
At the course level, predictions range from 8% too low for some courses to 9% too high for other courses . . . But the approach predicts the total number of students enrolled in Fall 2014 100-level MATH courses to better than 1%! Why does this simple approach fail at the course level?
At the course level, predictions range from 8% too low for some courses to 9% too high for other courses . . . But the approach predicts the total number of students enrolled in Fall 2014 100-level MATH courses to better than 1%! Why does this simple approach fail at the course level? Hidden assumption: Course capacities in Fall 2013 were infinite, so enrollments were a perfect reflection of instructional demand.
Data sources used: 1) FT FY enrollments from Fall 2013 2) Size of Fall 2013 FT FY class 3) Projected size of Fall 2014 FT FY class Other relevant data sources might include: 1) Math ACT scores of FT FY students 2) Math AP scores of FT FY students 3) Waiting lists from Fall 2013 4) Majors selected by FT FY students
Would these additional data sources help? Waiting lists: A student seeking a Social Sciences General Education course might put herself on the waiting list for both POLS 101 and PSYC 110, intending to take the first course in which she can find a seat. If no seats open up in either class, the waiting lists will register “excess demand”.
Would these additional data sources help? Choice of major: Students’ major choices are rather fluid. For example, the Fall 2013 entering class had 158 declared psychology majors in May 197declared psychology majors in August UTK typically grants 400 to 450 psychology B.A. degrees each year.
Take home message: Data-driven enrollment management is still in its infancy. We can take solace in this observation from the EAB pre-retreat reading (p. 3): “Many administrators held out hope for ‘a magic equation’ that would … serve as the basis for algorithms for setting optimal resource allocations … Unfortunately we did not discover such a magic equation.”
Thanks to: Pat Anthony Jason Smethers NikBrodskiy
NikBrodskiy Thanks again for the projections you made for Fall 2014. It worked very well. I would like to adjust the Spring 2015 schedule. Could you please let me know the projections for Math enrollments for the spring semester?