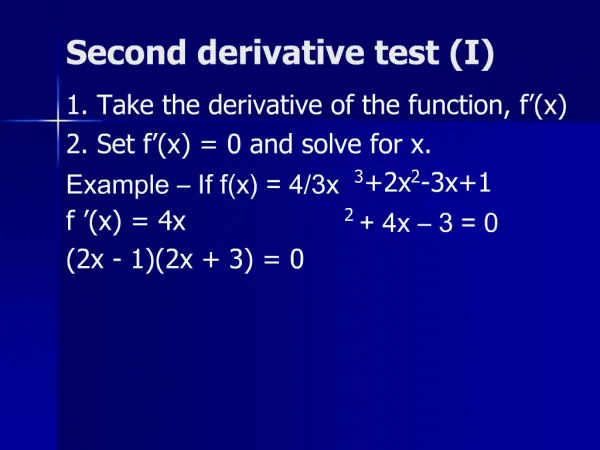
12.2 Second Derivative and Graphs
12.2 Second Derivative and Graphs. “If we think the derivative as a rate of change, then the second derivative is the rate of change of the rate of change” * The second derivative is the derivative of the derivative. Compare f(x ) and g(x).

12.2 Second Derivative and Graphs
E N D
Presentation Transcript
“If we think the derivative as a rate of change, then the second derivative is the rate of change of the rate of change” * The second derivative is the derivative of the derivative
Compare f(x) and g(x) Both are increasing functions but they don’t look quite the same.
Compare f’(x) and g’(x) Both f’(x) and g’(x) are positive, however, f’(x) – the slope of the tangent line - is increasing but g’(x) is decreasing
Concavity Tests Theorem. The graph of a function f is concave upward on the interval (a,b) if f ’(x) is increasing on (a,b), and is concave downward on the interval (a,b) if f ’(x) is decreasing on (a,b). For y = f (x), the second derivative of f, provided it exists, is the derivative of the first derivative: Theorem. The graph of a function f is concave upward on the interval (a,b) if f ’’(x) is positive on (a,b), and is concave downward on the interval (a,b) if f ’’(x) is negative on (a,b).
Relationship between F and F’’ F’’(x) F’(x) F(x) F: increasing on (-∞,-1) and (1,∞) decreasing on (-1,1) So F’ > 0 on (-∞,-1) and (1,∞) F’ < 0 on (-1,1) F’: decreasing on (- ∞, 0) increasing on (0, ∞) So F’’ < 0 on (- ∞, 0) F’’ > 0 on (0, ∞) F: concave down (- ∞, 0) concave up (0, ∞) So F’’ < 0 on (- ∞, 0) F’’ > 0 on (0, ∞)
Concavity Concave down Concave up
Concavity up down up
Example 1 Determine the intervals on which the graph is concave upward and the intervals on which it’s concave downward. • f(x) = -e-x Domain (-∞∞), no critical point f’(x) = -e-x (-1) = e-x f’’(x) = e-x (-1) = -e-x Test some numbers in the domain (review section 11.1 if you forgot), we will see that f’’ is always negative. Therefore, the graph of f(x) is concave downward on (-∞∞)
Example 1 (continue) Determine the intervals on which the graph is concave upward and the intervals on which it’s concave downward. B) f(x) = ln (1/x) (that should equal ln 1 – lnx) Domain (0,∞), no critical point f’(x) = -1/x = -x-1 f’’(x) = x-2 = 1/x2 Test some numbers in the domain, we will see that f’’ is always positive. Therefore, the graph of f(x) is concave upward on (0,∞)
Example 1 (continue) Determine the intervals on which the graph is concave upward and the intervals on which it’s concave downward. C) f(x) = x1/3 Domain (-∞,∞), critical value is x = 0 Since there is a critical point, we want to test some points on the left of 0 and some on the right of 0. We will see that f’’ is always positive on the left of 0 and always negative on the right of 0. Therefore, the graph of f(x) is concave upward on (-∞, 0) and concave downward on (0, ∞). Note that this graph changes from concave upward to concave downward at (0,0). This point is called an inflection point.
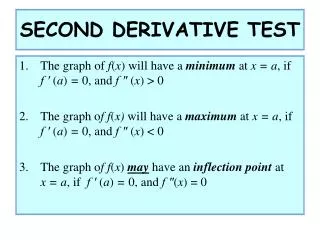
Inflection Points An inflection point is a point on the graph where the concavity changes from upward to downward or downward to upward. This means that if f ’’(x) exists in a neighborhood of an inflection point, then it must change sign at that point. Theorem 1. If y = f (x) is continuous on (a,b) and has an inflection point at x = c, then either f ’’(c) = 0 or f ’’(c) does not exist.
Example 2 Find the inflection point(s) of f(x) = x3 – 9x2 +24x -10 F’(x) = 3x2 – 18x + 24 F’’(x) = 6x – 18 = 0 6(x-3) = 0 x = 3 Note: It’s important to do this test because the second derivative must change sign in order for the graph to have an inflection point. x 2 3 4 F’’ -- 0 + Concave down Concave up Therefore 3 is the infection point of f(x)
Example 3: A special case Find the inflection point(s) of f(x) = x4 F’(x) = 4x3 F’’(x) = 12x2 = 0 x = 0 x -1 0 1 F’’ + 0 + Concave up Concave up Therefore 0 is not the inflection point of f(x) There is no inflection point for this graph
Example 4 Find the inflection point(s) of f(x) = ln(x2 - 2x + 5) x = -1 and x =3 x -2 -1 0 3 4 F’’ - 0 + 0 - Concave up Concave down Concave down Therefore there are two inflection points at x= -1 and x=3
Example 5 The given graph shows the graph of the derivative function f’(x). Discuss the graph of f and sketch a possible graph of f. x F’(x) F(x) F’(x) (-∞,-1) Positive Decreasing Increasing Concave down X= -1 Local minimum Inflection point (-1,1) positive increasing Increasing Concave up X=1 Local maximum Inflection point (1,2) Positive decreasing Increasing Concave down X=2 X-intercept Local maximum (2, ∞) Negative decreasing Decreasing Concave down
With today technology, graphing calculator and computer can produce graphs. However, important points on a plot may be difficult to identify. • Therefore, it’s useful to learn how to sketch a graph by hand.
Curve Stretching • Analyze f(x). Find the domain and intercepts. (Set x=0, solve for f(x); set f(x)=0, solve for x). • Analyze f’(x): Find critical values. Determine increasing and decreasing intervals as well as local maximum and/or minimum. (set f’(x)=0). • Analyze f’’(x): Find inflection point. Determine the intervals on which the graph is concave upward and concave downward. (set f’’(x)=0). • Plot additional points as needed and sketch the graph.
Example 6 Sketch f(x) = x4 + 4x3 by hand Step 1: Domain: (-∞,∞) X: intercept: x4 + 4 x3 = 0 x3 (x+4) = 0, so x=0 or x = -4 Y: intercept: f(0) = 0 Step 2: f’(x) = 4x3 + 12x2 = 0 4x2 (x+3) = 0 so x= 0 or x=-3 both critical v. Test numbers on the left and on the right of 0 and -3, we see that -3 is a local minimum. Also, f(x) is decreasing on (- ∞, -3) and increasing on (-3, ∞). Step 3: f’’(x) = 12x2 + 24x = 0 12x(x+2) = 0 so x = 0 or x = -2 Test numbers on the left and on the right of -2 and 0, we see that both of them are inflection points. Also, the graph is concave upward on (- ∞, -2), concave downward on (-2,0), and concave upward on (0, ∞)
Example 7 Sketch f(x) = 3x2/3 - x by hand Step 1: Domain: (-∞,∞) X: intercept: 3x2/3 - x = 0 x (3x-1/3 - 1) = 0, so x=0 or 3x-1/3 – 1 = 0 x-1/3 = 1/3, (x-1/3)-3 = (1/3)-3 , so x = 27 Y: intercept: f(0) = 0 Step 2: f’(x) = 2x-1/3 -1 = 0 x-1/3 = 1/2, (x-1/3)-3 = (1/2)-3 , so x= 8 Also, f’(x) is discontinuous at 0. Test numbers on the left and on the right of 0 and 8, we see that 0 is a min and 8 is a max. Also, f(x) is decreasing on (- ∞, 0) and (8, ∞) and increasing on (0,8) Step 3: f’’(x) = (-2/3) x-4/3 = 0 x-4/3 = 0; so x = 0 F’’ is also discontinuous at 0. Test numbers on the left and on the right of 0, we see that there is no inflection point. The graph is concave downward on (- ∞, 0) and on (0, ∞)
Continue: Sketch f(x) = 3x2/3 - x May need to add more points on the left of 0 to have a better graph
The value of x where rate of change of sales changes from increasing to decreasing is called the point of diminishing returns. This is also the point where the rate of change has a maximum value.
Example 8 • A discount appliance store is selling 200 television sets monthly. If the store invests $x thousand in an advertising campaign, the ad company estimates that sales will increase to N(x) = 4x3 -.25x4 + 500, with 0≤x≤12. When is rate of change of sales increasing and when is it decreasing? What is the point of diminishing returns and the maximum rate of change of sales. • The rate of change of sales with respect to advertising expenditures is the derivative N’(x). To determine when N’(x) is increasing or decreasing, we find N’’(x) • N’(x) = 12x2 – x3 N’’(x) = 24x – 3x2 = 0 3x (8 – x) = 0 so x = 0 or x = 8 Therefore, the rate of change of sales is increasing on (0, 8) and decreasing on (8,12). The point of diminishing returns Is x = 8 and the maximum rate of change Is N’(8) = 256. We do not need to know the outcome on the left of 0 because 0≤x≤12