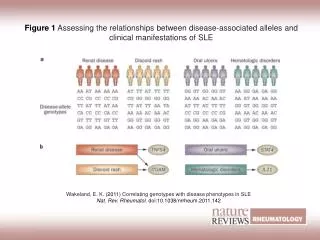
Association tests for correlating genotypes against phenotypes
Association tests for correlating genotypes against phenotypes. Basics of association testing. Consider the evolutionary history of individuals proximal to the disease carrying mutation. Association testing.

Association tests for correlating genotypes against phenotypes
E N D
Presentation Transcript
Association tests for correlating genotypes against phenotypes
Basics of association testing • Consider the evolutionary history of individuals proximal to the disease carrying mutation.
Association testing • The goal of association testing is to identify SNPs that ‘associate’ (are correlated) with the phenotype. • Recall that spatially close SNPs are correlated because of LD. • As we go further, recombination changes evolutionary history, and the SNPs are no longer correlated.
Statistical hypothesis testing • Example (from wiki) • An individual claims to be clairvoyant. To test this, pick 25 cards from a deck (with replacement) and ask him to guess the color each time. • He guesses correctly c times • Is he clairvoyant • If c=25? • If c= 6? • If c= 10?
Statistical hypothesis testing • Goal is to take observations and reach a conclusion. The conclusion is often a decision between two hypotheses. • H0: (Null) the individual is not clairvoyant • H1: (Alternative) The individual is clairvoyant
Decision • Probability of error (of the first kind) • Probability (reject H0| H0 is valid) • In this case
Tests for association: Pearson Cases Controls O1 MM Mm mm • Case-control phenotype: • Build a 3X2 contingency table • Pearson test (2df)= O2 O3 O4 O5 O6
The χ2 test Cases Controls O1 O2 MM O3 O4 Mm O5 O6 mm • The statistic behaves like a χ2 distribution. • A p-value can be computed directly
Χ2 distribution properties A related distribution is the F-distribution
Likelihood ratio • Another way to check the extremeness of the distribution is by computing a (log) likelihood ratio. • We have two competing hypothesis. Let N be the total number of observations
LLR • An LLR value close to 0, implies that the null hypothesis is true. Asymptotically, the LLR statistic also follows the chi-square distribution.
Exact test • The chi-square test does not work so well when the numbers are small. • How can we compute an exact probability of seeing a specific distribution of values in the cells? • Remember: we know the marginals (# cases, # controls,
Fischer exact test Cases Controls a b MM c d Mm e f mm • Num: #ways of getting configuration (a,b,c,d,e,f) • Den: #ways of ensuring that the row sums and column sums are fixed
Fischer exact test • Remember that the probability of seeing any specific values in the cells is going to be small. • To get a p-value, we must sum over all similarly extreme values. How?
Test for association: Fisher exact test Cases Controls a b MM c d Mm e f mm • Here P is the probability of seeing the exact count. • The actual significance is computed by summing over all such tables that are at least this extreme.
Continuous outcomes • Instead of discrete (Case/control) data, we have real-valued phenotypes • Ex: Diastolic Blood Pressure • In this case, how do we test for association
Continuous outcome ANOVA • Often, the phenotypes are not offered as case-controls but like a continuous variable • Ex: blood-pressure measurements • Question: Are the mean values of the two groups significantly different? MM mm
Two-sided t-test • For two categories, ANOVA is also known as the t-test • Assume that the variables from the two sets are drawn from Normal distributions • Different means, equal variances • Null hypothesis is that they are both from the same distribution
Two-sample t-test • As the variance is not known, we use an estimate S, defined by • The T-statistic is given by • Significant deviations from 0 are used to reject the Null hypothesis
Two-sample t-test (unequal variances) • If the variances cannot be assumed to be equal, we use • The t-statistic is given by • Significant deviations from 0 are used to reject the Null hypothesis
Continuous outcome ANOVA • How do we extend the t-test when we have multiple groups? MM mm
F-statistic for 2 groups explained variance (with m+n-1 – (m+n-2) = 1 df) • Under the alternative hypothesis, the variance is reduced Unexplained variance (with m+n-2 df)
A generic ANOVA strategy • Consider a null model (p1 parameters), and an alternative model (p2> p1 parameters) • The alternative model can be parameter free (ex: groupings of the phenotype values according to genotypes), or based on a model (ex: additive) • If based on a model, compute the optimum parameters • Compute the reduction in variance. • Use an F-test for association
Haplotype testing • Why test with multiple SNPs? • Pros: haplotypes might be better correlated with disease outcome • The tests are similar, except that instead of 3 rows, we have a certain number (k) of haplotypes.
Haplotype testing • Any of the tests described before can be used for haplotype based contingency tables. • What are the Pros and cons of using haplotypes?
Linear regression • Sometimes, we have additional information on phenotype values • Ex: the phenotype value might be additive in the number of alleles
Linear regression • The parameters can be estimated using linear regression analysis • Let Xijbe the phenotypic value of the j-th individual in class i (genotype i) • Xij=+i+ij • i=0 • Generally, • X=C+ • Goal is to estimate so that |||| is minimized • Why is this useful? • How do we optimize the choice of ?
Why: Linear regression testing • Recall that we want to test if the genotype is useful in predicting phenotype (X) • If not, then the null model Xij=+ij should have the same amount of variance in the residual ij
Linear regression • Linear regression methods can be used to estimate the parameters of • X = C+ • To test for association, estimate the parameters for two models • Ex: Xij=+i+ijvsXij=+’ij • Note that both , ’ are assumed to be random variables with mean 0, and that Var()<=Var(’) • We can test for association by asking if the reduction in variance Var(’)-Var() is significant • This can be done parametrically (Ex: F-test) • Or, non-parametrically, using a permutationtest
How: Solving for least squares • Min||Cβ-x||2 • It is solved by
Association test summary (Single locus) • Discrete outcomes (case-control) • Pearson’s/Fischer exact test • Continuous variables • T-test (2 categories) • ANOVA (multiple categories) • Linear regression (multiple categories with linearity assumption) • Single locus can be extended to haplotypes • Multiple correlated SNPs • Only change is that the number of categories expands.
Epistatic and gene environment interactions • The typical Mendelian disorder assumes that there is a single causal variation. • Having the variation pre-disposes you to a certain phenotype • For complex disease, this may not be a correct model • Different variants may combinatorially interact
Two-way ANOVA • Suppose that there are two ways of classifying individuals. • Ex: genotypes at two loci • Ex: genotype versus sex • Ex: genotype versus environment • Assume that there are sufficient individuals in each cell. • Estimate the means/variances in each cell • An ANOVA test may be used to determine if the values can are significantly different M F aa Aa AA
2-way ANOVA model • Xijk: phenotype value for the k-th individual in cell (i,j) • Assume that Xijk=+i+j+ij+ijk • i j are fixed parameters contributing to class i,j • ij is a parameter corresponding to interaction between class i,j • i nii =0, njj =0,nij ij =0
ANOVA model • We have two questions: • Are the loci associated with the disease? • To answer this, test this model against the null model Xijk=+ijk • Is epistatic interaction important • Test this model against Xijk=+i+j+ijk • (Set ij = 0 in the null hypothesis)
Algorithmic issues in multi-locus genome-wide association mapping
Detecting multiple loci • The most naïve strategy, is to look at all pairs of loci (or all k-tuples) that influence a complex disease. • This is computationally intensive, and also has a problem with multiple testing. • Other strategies: • Consider a subset S of SNPs that show an association individually. • Limit association testing to pairs: • At least one of the SNPs comes from S • Both SNPs come from S
Two locus testing results • The power represents the fraction of times the test succeeded in detecting the right pair. • The pair-wise models often do much better than the other models. Model 1 Model 2 Model 3
Margin based filtering Controls Cases Controls 0 1 Genotypes at X Cases 0 1 Genotypes at X Control Cases 0 1 Genotypes at Y Genotypes at Y • Consider only those locus pairs that show a marginal effect. Ex: Marchini et al.
Decomposition of 2X2X2 Controls Cases Controls 0 1 Cases 0 1 0 1 Control Cases 0 1
Pairwise interactions Chi-square(x,y,d) is high Chi-square (x,d) is high OR Chi-square (y,d) is high OR Chi-square (x,y) when limited to cases is high OR Chi-square (x,y) when limited to controls is high. When restricted to cases, X and Y show high correlation. But, testing requires nm2 time Cases T A -n/8 n/8 -n/8 n/8 A G
Paired Interactions (3X3X2 contingency) Controls Cases 0 1 2 Genotypes at X So, where is the problem? 0 1 2 Genotypes at Y