1 / 14

CMAQ 4.5 and 4.4 Comparison

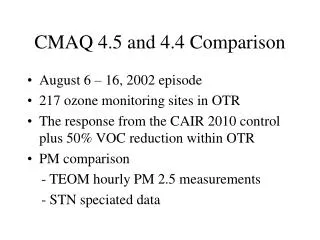
CMAQ 4.5 and 4.4 Comparison. August 6 – 16, 2002 episode 217 ozone monitoring sites in OTR The response from the CAIR 2010 control plus 50% VOC reduction within OTR PM comparison - TEOM hourly PM 2.5 measurements - STN speciated data. Scatter plot.

lyris
Télécharger la présentation

CMAQ 4.5 and 4.4 Comparison

An Image/Link below is provided (as is) to download presentation Download Policy: Content on the Website is provided to you AS IS for your information and personal use and may not be sold / licensed / shared on other websites without getting consent from its author. Content is provided to you AS IS for your information and personal use only. Download presentation by click this link. While downloading, if for some reason you are not able to download a presentation, the publisher may have deleted the file from their server. During download, if you can't get a presentation, the file might be deleted by the publisher.

E N D

Presentation Transcript


  1. CMAQ 4.5 and 4.4 Comparison • August 6 – 16, 2002 episode • 217 ozone monitoring sites in OTR • The response from the CAIR 2010 control plus 50% VOC reduction within OTR • PM comparison - TEOM hourly PM 2.5 measurements - STN speciated data

  2. Scatter plot

  3. Statistics: 8-Hour Daily Max Ozone

  4. Ratio of CAIR 2010+50VOCOTR Control to 2002 Base (above 60 ppb)

  5. Daily Averaged PM2.5

  6. Diurnal Variation PM2.5

  7. STN PM2.5

  8. STN SO4

  9. STN NO3

  10. STN NH4

  11. EC at STN

  12. OC at STN

  13. Summary • CMAQ 4.5 predicted higher 8-hour ozone concentration than CMAQ 4.4. • CMAQ 4.5 response to emission reduction more sensitive than CMAQ 4.4 in this August 2002 episode. • CMAQ 4.5 predicted lower PM2.5 concentration than CMAQ 4.4.

More Related