Download
1 / 57
570 likes | 729 Vues
Climate Change in the Northeast U.S. Dr. Art DeGaetano, Professor Department of EAS Director of the NOAA Northeast Climate Center, Cornell University. Global Average Annual Temperature Anomaly ( o F) From meteorological stations 1880-2005.

E N D
Climate Change in the Northeast U.S. Dr. Art DeGaetano, Professor Department of EAS Director of the NOAA Northeast Climate Center, Cornell University
Global Average Annual Temperature Anomaly (oF)From meteorological stations 1880-2005 Hansen et al. (2001) J. Geophysical Res. Vol 106, p. 23,947-23,963 Data from http://www.giss.nasa.gov/data/update/gistemp/
Average Annual Temperature in the Northeast 1899-2000 Time-series represents an areally weighted average of data from 56 stations in the Northeast that have been in operation continuously since 1900. Data from the NOAA-NCDC (ftp://ftp.ncdc.noaa.gov/pub/data/ushcn).
Spatial Variation of Annual Temperature Trend 1899-2000 Linear trend in annual temperature (oF) from 1899-2000 for the Northeast. The change was estimated from a linear regression of annual average temperature for each station.
Average Winter Temperature in the Northeast 1899-2000 Time series represent areally weighted average of 56 meteorological stations.
Spatial Variation Winter Linear Temperature Trend 1970-2000 Linear trend in winter temperature (oF) from 1970-2000 for the Northeast. The change was estimated from a linear regression of annual average temperature for each station.
Spatial Variation of Growing Season (32oF) Trend 1970-2000 Linear trend in length of growing season (days) from 1970-2000 for New England. The change was estimated from a linear regression of annual average growing season length for each station.
Average Annual Precipitation in the Northeast, 1899-2000 Time series represent average of 79 meteorological stations in the Northeast.
23% 16% 67% 31% 15% 3% 20%
Spatial Variation of Snowfall Trend 1970-2000 Linear trend in DJF snowfall s estimated from a linear regression of data for each station
Average Ice Out Day Trend 1925-2001 (27 Lakes) 6 days earlier over last 77 years 13 days earlier over last 30 years Ice Out Dates compiled by Hodgkins et al., 2002.
Dates of Center-of-Volume River Flow Smooths of the winter/spring (Jan 1 to May 31) center-of-volume dates for the 13 longest record, rural, unregulated rivers in New England (Hodgkins et al., 2003)
Lake Levels Erie Ontario
Sea Surface Temperatures Gulf of Maine 1.1oF warming over last 150 years 1.6oF warming over last 150 years
ClimAID:Integrated Assessment for Effective Climate Change Adaptation Strategies in New York State To provide New York State with cutting-edge information on its vulnerability to climate change and to facilitate the development of adaptation policies informed by both local experience and state-of-the-art scientific knowledge.
Sectors - Agriculture/Ecosystems - Coastal Zones - Energy - Public Health - Transportation/ Communication - Water Resources Key Themes - Climate Risks - Vulnerability - Adaptation Cross Cutting Elements - Science/Policy Linkages - Economic Policy Linkages - Environmental Justice
Quantitative Projections by Region: Mean Changes Utica, Yorktown Heights, Saratoga Springs, Hudson Correctional Facility Boonville, Watertown 7 6 5 1 3 2 4
Sea level rise • Directly from GCMs No downscaling • Thermal expansion • Glacier melt • Ice cap/ice sheet melt • Local land sinking/subsidence • Local water surface elevation Source: CCSR
Sea level rise • Rapid ice melt • based on paleoclimate data • 20,000 – 10,000 0.39-0.47 in/yr • Local modeling for Hudson to Troy • river has low topographic gradient • change at Battery = change at Albany Source: CCSR
Sea level rise NYC Troy Source: CCSR
Flooding -- relative contribution of rain vs pet will lead to floods or droughts, and uncertainty less snow / more rain larger storm rainfall amounts more ET/ drier soils longer growing season ? = + + + Years
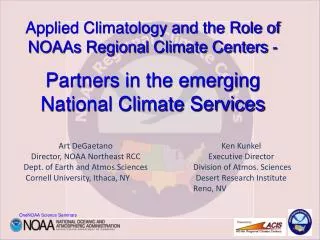
About the NOAA Northeast Regional Climate Center at Cornell University
Mission of the RCCs • Facilitate the collection, dissemination, quality and use of climate data • Monitor regional climate conditions and their impacts • Conduct applied research
AgACIS(Custom NRCS data and products) http://agacis.rcc-acis.org/