Download
1 / 46
460 likes | 555 Vues
This study analyzes the impact of bias corrections on historical storm counts using best track data. Findings suggest a link to large-scale warming, shaping tropical cyclone counts. Key findings from notable researchers in the field are discussed.

E N D
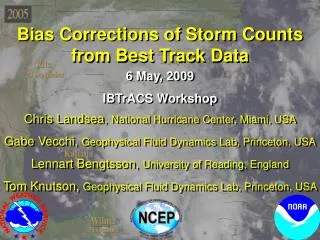
Bias Corrections of Storm Counts from Best Track Data 6 May, 2009 IBTrACS Workshop Chris Landsea, National Hurricane Center, Miami, USA Gabe Vecchi, Geophysical Fluid Dynamics Lab, Princeton, USA LennartBengtsson, University of Reading, England Tom Knutson, Geophysical Fluid Dynamics Lab, Princeton, USA
“This record [of Atlantic tropical cyclone counts] … shows a strong, long-term relationship with tropical Atlantic August-October SST…The underlying factor appears to be the influence of (primarily anthropogenic) forced large-scale warming.”
“Although wind estimates prior to the 1940s are problematic, detection of the existence of tropical cyclones is less so, because without aircraft and satellites to warn them off, ships often encountered storms at sea, at least peripherally. A reasonably reliable record of annual North Atlantic tropical cyclone counts is thus available back into the late nineteenth century.” --- Mann and Emanuel (2006)
2005 Hurricane Season Open Atlantic Ocean Differences 1933 Hurricane Season
Tropical Storm and Hurricane Numbers – A Very Large Trend over a Century 12 7
2007 Hurricane Season - 16 Tropical Storms & Hurricanes… …9 of which were very short-lived (< 36 hr)
New Tools and Technologies ~ Additional TCs lately? Hart’s Cyclone Phase Space Analyses Quikscat Surface Vectors AMSU Tropospheric Temperatures
Changes in “Naming” Criteria “If it was quite marginal as to whether or not a storm would be upgraded to tropical storm status or equivalent, that decision would likely be influenced by proximity to possible impacts on land within the next 48 hours or so. That is, I suspect that the margin of acceptable error for most of us would be a little larger over the open sea as compared to potential landfall for such storms that are not all that strong anyway.” Bob Sheets, National Hurricane Center Director, 1987-1995
Six weak, short-lived storms in last two seasons – Unlikely to have been “named” previously
2002 onward: AMSU, QuikScat, Cyclone Phase Space, Advanced Dvorak
Big Upward Trend – Consistent with Technological Improvements
Tropical Storm and Hurricane Numbers – A Very Large Trend over a Century 12 7
Tropical Storm and Hurricane Numbers - Trend Nearly Gone after Removal of Very Short-Lived Cyclones 8 7
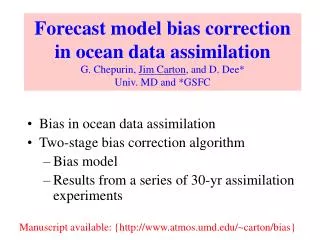
Atlantic ship traffic changes Vecchi and Knutson (2008)
Estimated Number of “Missed” Tropical Storms and Hurricanes of Medium to Long Duration 2-3 per year in 1880s 1-2 per year in 1900s <1 per year in 1950s
Tropical Storm and Hurricane Numbers – Upward Trend Gone After Adding in “Missed” and Removing Very Short-Lived Cyclones 9 8
Bias Corrections of Storm Counts from Best Track Data 6 May, 2009 IBTrACS Workshop Chris Landsea, National Hurricane Center, Miami, USA Gabe Vecchi, Geophysical Fluid Dynamics Lab, Princeton, USA LennartBengtsson, University of Reading, England Tom Knutson, Geophysical Fluid Dynamics Lab, Princeton, USA
North Atlantic SSTs and Quadratic Trend Residual Atlantic Multidecadal Oscillation Enfield and Cid (2009)
Changes in “Naming” Criteria ““[The National Hurricane Center] seems to be naming a lot more than they used to. This year, I would put four storms in the very questionable category, and maybe even six. In the past, we would have waited to see if another observation supported naming the system. We would have been a little more conservative." Neil Frank, National Hurricane Center Director, 1974-1987
Frequency of Tropical Cyclones in Today’s Climate Today’s Climate Landsea and Bengtsson (2008)
Frequency of Tropical Cyclones in Today’s Climate …Based upon Differing Thresholds of Duration Landsea and Bengtsson (2008)
Global Warming and Hurricanes: Theory and Modeling Work Suggest 2% wind increase with a DECREASE in frequency by late 21st Century Knutson et al. (2008)
Frequency of Tropical Cyclones in Today’s Climate Today’s Climate Bengtsson et al. (2007) Landsea and Bengtsson (2008)
Frequency of Tropical Cyclones in Today’s Climate Versus Global Warming Climate Today’s Climate Late 21st Century Bengtsson et al. (2007) Landsea and Bengtsson (2008)
Maximum Potential Intensity Change Atlantic Basin: +1% stronger per oC SST change Vecchi and Soden (2007)
Knutson and Tuleya (2004)
Increased Wind Shear from Global Warming Vecchi and Soden (2007)
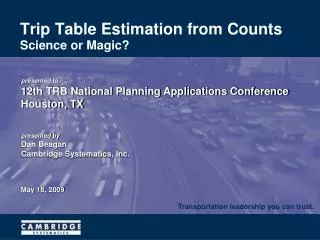
What does the Atlantic hurricane database (HURDAT) show for changes in time of tropical cyclone frequency?
Satellite era - 59% strike land
Pre-satellite era - 75% strike land
Atlantic Hurricane Database Re-Analysis Project http://www.aoml.noaa.gov/hrd/data_sub/re_anal.html 1851 through 1920 changes accepted and officially adopted by NHC. 1921 through 1925 will be made available shortly. Remainder of 20th Century currently being reanalyzed. RE-ANALYSES NEED TO BE CONDUCTED GLOBALLY!!! "Florida's Hurricane History"