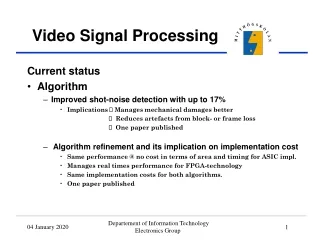
Signal Processing
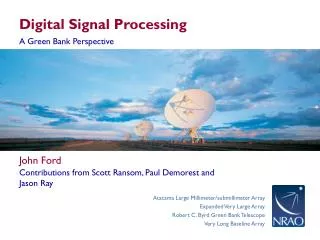
Chiba University. Signal Processing. Synthetic Aperture Radar. Josaphat Tetuko Sri Sumantyo, Ph.D. Center for Environmental Remote Sensing, Chiba University. Contents. 1. Introduction of Synthetic Aperture Radar (SAR)


Signal Processing
E N D
Presentation Transcript
Chiba University Signal Processing Synthetic Aperture Radar Josaphat Tetuko Sri Sumantyo, Ph.D Center for Environmental Remote Sensing, Chiba University
Contents 1. Introduction of Synthetic Aperture Radar (SAR) 2. SAR Applications (History, Theory, Relationship with Remote Sensing etc) 3. Basic of Electromagnetic waves (Wave, Polarization, Absorption, Scattering etc) 4. Radar Equation and Microwave Scattering (Antenna Pattern) 5. Pulse Compression Technique and Image Production in Range Direction 6. Synthetic Aperture Technique and Image Production in Azimuth Direction 7. Basic of SAR Image Analysis
Introduction SAR and Definition SAR (Synthetic Aperture Radar) Satellite (sensor) itself illuminates microwave, then sensor receives backscattered wave and processes this signal to be an image. Benefit of SAR All weather Day and night time monitoring (Active sensor) High coherency → InSAR applications Polarization characteristics → Polarimetry Lack of SAR Analysis of backscattering Microwave Image very complicated (Different to the point of view in optical image analysis) Image distortion (foreshortening, shadowing etc) caused by side looking • Microwave Sensor • Active Sensor • Imaging Radar
Introduction Pictures : http://southport.jpl.nasa.gov/nrc/chapter7.html
Introduction Pictures : http://southport.jpl.nasa.gov/nrc/chapter7.html
Introduction http://alos.nasda.go.jp/
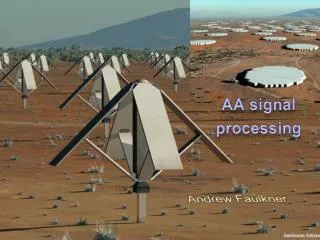
Satellite-onboard SAR and flat-ground geometric system sensor / antenna ①: off-nadir angle (look angle) ②:depression angle ③:range beam width ④:incidence angle ⑤:azimuth beam width horizontal direction platform direction ② ① ③ slant range direction range direction ⑤ azimuth direction ④ far range near range Ground range target Pi-SAR (NICT/JAXA) JERS-1 SAR antenna
Optic sensor and microwave sensor • Optic sensor :employed wavelength is recognized by human eyes • Sun light scattering easy to recognize • Microwave sensor :wavelength is cm order difficult to recognize • Mechanism of backscattering complicated • Image distortion Mount Fuji : JERS-1 / OPS Mount Fuji : JERS-1 / SAR
Microwave characteristics Wave expression : phase and amplitude Electromagnetic fields vibrate as the function of time when observed in one point in the space Space distribution of electromagnetic fields is the function of space when time is fixed wavelength amplitude electric field space (x) electric field time(t) phase:f Time changing signal can be expressed as space function by using variable of amplitude and phase df wave expression: F(t)=exp[2pift] f : frequency = f dt
Wavelength Domain of Microwave 10GHz 1GHz 0.2mm 1.0mm 10mm 1mm 10cm 1m VisibleMicrowave IR NIR KaKuX C S L P Wavelength domain of electromagnetics and definition 100 Atm. Pen.% 50 0 0.2mm 1.0mm 10mm 1mm 10cm 1m wavelength Atmospheric penetration ratio
Reflection and Penetration of Microwave scattering wave incident wave Relationship of scattering and penetration q q ratio of scattered and penetrated wave : effect of dielectric constant mirror / corner reflection : effect of surface roughness penetrated wave q`
Reflection and Penetration of Microwave corner reflection water / sea surface : high dielectric constant perfectly scattering / corner reflection black color on SAR image Krakatau volcano complex, Indonesia
Reflection and Penetration of Microwave Effect of earth’s surface : Rayleigh conditions : h≦l/(8 cos q) →standard of smooth surface in case of JERS-1: l=0.23m, q=38o Conditions to satisfy ① : h≦3.65 cm ③ rough surface ① smooth surface ② slightly rough surface Illustration of microwave scattering by earth’s surface
③ rough surface ① smooth surface ② slightly rough surface Krakatau volcano complex, Indonesia
Scattering of microwave : surface scattering and volume scattering • Surface scattering (a) scattering on the boundary surface (different dielectric constant ) (b) scattered wave is reflected to different direction from incident wave • Volume scattering (a) Penetrated electromagnetic wave is traped in the dielectical material (b) Scattered wave in object on the earth’s surface (i.e. forest)
Scattering of microwave : surface and volume scatterings Scattering Models vegetation (forest) icy river surface scattering surface scattering volume scattering volume scattering surface scattering surface scattering dried sandy area surface scattering volume scattering surface scattering
Polarizations Linier polarization Linier polarization Horizontal polarization Left handed circular polarization(LHCP) Circular Pol.
SAR History 1953Carl Wiley (Good Year Corporation) invented SAR 1960s Civil application : archeology, real aperture interferometry 1978 SEASAT (NASA) : 25m resolution, L band 1980s ALMAZ (Soviet), Shuttle Imaging Radar (SIR)(NASA) 1991 ERS-1 (ESA), Interferometry, C band 1992 JERS-1 (JAXA), 12.5m resolution, L band 1995 RADARSAT (RSI) 1999 SRTM, single pass interferometry, 80% continental coverage 2002 ENVISAT (ESA) 2006 ALOS
Basic Theory of SAR : Antenna wave illuminating pattern L=11.92 m b=2.2 m ‘half value’ JERS-1 SAR antenna b : antenna length in range direction L : antenna length in azimuth direction a : half value in range direction (JERS-1 : 5.3o) b: half value in azimuth direction (JERS-1 : 1.0o)
y side lobe main lobe 1 1/2 x L b0 P1 sensor/antenna P0 z y L a0 x b0 b Basic Theory of SAR : Antenna Definition of half value : Po: power in the center of main lobe P1 : power in the peripheral of main lobe The half value is defined by ‘P1is attenuated to 3 dB (equally 50%) of Po’. 10log10Po/P1=3 dB or P1=0.5P0
Basic Theory of SAR : Radar Equation • Radar equation : • To realize the relationship between radar received power and characteristic of scatterer. • A : effective surface of the receiver’s antenna • G : gain • : radar cross section or back scatterer surface Pt: transmitted power Ps : scattered power Pr: received power Pr=PsA/4pR2 Ps=PtG/4pR2s Pt antenna R attenuation by spreading of wave = 1/4pR2 PtG/4pR2 Scatterer Pr=Ps A/4pR2=PtGAs/(4pR2)2
Pulse radar Pulse power (Transmitted power) || peak power×pulse width sensor / antenna 0 22 1 20 21 18 2 19 20 17 3 18 4 19 16 JERS-1 SAR antenna 17 5 18 15 6 16 17 7 14 15 16 propagation of transmitted pulse 8 13 14 9 15 12 Rn : slant range length at near range Rf : slant range length at far range Time to receive the pulse by antenna : Near range side (start to receive) : 2Rn/C Far range side (end of receiving) : 2Rf/C+τ Continuity time of received pulse : T=(2Rf /C+τ)-2Rn/C 13 10 14 11 11 12 13 10 12 11 12 tree house Rn Rf concrete building (a)Pulse front wave Transmitted pulse received signal concrete building’s echo Signal intensity house’s echo tree’s echo 0 2 4 6 8 10 12 14 16 18 20 22 24 time Pulse width τ (b)Time flows of transmit & received signal
Flowchart of SAR Signal Processing Start Parameter calculation Doppler center frequency Range compression Corner turn Azimuth compression Output image
Flowchart of SAR Signal Processing Range JERS-1 satellite Azimuth corner turn North range compressed image raw data North sensor illumination azimuth compressed image rotated image
B B A A
ct DR q q earth’s surface q Dx
frequency MHz 1282.5 1275.0 Df=15 MHz 1267.5
pulse length (t) A B C transmitted pulse received pulse time t t reference signal output signal 1/Df time A B C 1/Df
L b=l/L R P d
Az Az t=0 t=0 R R Az t=0 R
R Az