Download
1 / 11
130 likes | 421 Vues
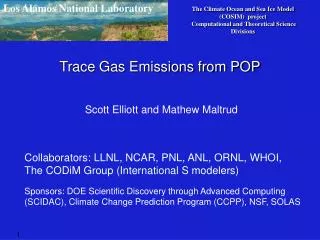
Geostationary Trace Gas and Aerosol Sensor Optimization ( GeoTASO ) ESTO IIP. 21 May 2013 Jim Leitch, PI jleitch@ball.com 303-939-5280. Outline and Team. NASA ESTO quad chart Sensor overview Project objectives Sensor status Expected sensor performance Algorithm preparation Plans.

E N D
Geostationary Trace Gas and Aerosol Sensor Optimization (GeoTASO) ESTOIIP 21 May 2013 Jim Leitch, PI jleitch@ball.com 303-939-5280
Outline and Team • NASA ESTO quad chart • Sensor overview • Project objectives • Sensor status • Expected sensor performance • Algorithm preparation • Plans • Ball Sensor Team: • Tom Delker, Lead • Bill Good, Airborne Lead • Many supporting engineers and technicians • Co-Investigators • Kelly Chance, Xiong Liu – Harvard/SAO • Scott Janz, Ken Pickering, Nick Krotkov – NASA/GSFC • Jun Wang – U Nebraska
Sensor Concept Overview • Nadir-viewing wide-swath imaging spectrometer • Two channel spectrometer uses: • 1st order diffraction for Visible • 2nd order diffraction for UV • Low polarization sensitivity telescope (<3%) and electronic depolarizer for spectrometer • Field-swappable spectrometer slits to change spectral passband and sampling • Selectable view: wide nadir swath or zenith look with an optical fiber
GeoTASO Advances Mission Readiness of GEO-CAPE UV-Vis Sensing • Hardware demonstration: • Compact spectrometer • Minimal blur depolarizer in a spectrometer • Filtering scheme effectiveness • Sensor-algorithm system demonstration: • Real scene data with variable spectral/spatial sampling and varying polarization sensitivity • Effect on algorithm of spectral dispersion/filtering in spectrometer • Prediction/Validation: • Component and system performance measurements inform TEMPO • DISCOVER AQ contribution as “satellite analog” measurement from moderately high altitude overflights of DISCOVER-AQ test sites • Flights with DISCOVER-AQ provide rich data set of measurements for comparison and validation of retrievals
Sensor Status (1 of 2) • Telescope in alignment • Built on separate baseplate • Spectrometer aligned: • All optics in place • Initial imaging measurements made • Vertical alignment (flight configuration) verified • Detector alignment underway Grating ghost is < 1e-4 of signal
Sensor Status (2 of 2) • Completed preliminary engineering and airworthiness reviews with Langley flight team Imaging performance predicts lineshape within specification GeoTASO sensor in its thermally-stabilized enclosure and mounting frame for the Falcon GeoTASO sensor in the nadir well with electronics racks • Lineshape asymmetry of <4% • Lineshape from imaging spot convolved with slit width to give passband shape
GeoTASO Predicted SNR • SNR predictions for 1 km square ground sample • Required SNRs shown as a band-averaged value (red lines) • Single sample SNRs are ~100x smaller (GSD: 40 m x 80 m) NO2 NO2 CHOCHO SO2 HCHO CHOCHO SO2 O3 HCHO O3 O3 O3 • 3 samples/FWHM, SN03 grating, updated well and noise values, • 0.6 mm flattening filter thickness
GeoTASO Predicted Saturation • Attenuation of visible channel from color filter glass in telescope • Adjustable amount of filtering using different filter thicknesses • Shorter integration times (in snapshot mode) can capture high signal scenes for cloud/aerosol studies in O2 B band • 3 samples/FWHM, SN03 grating, updated well values, • 0.6 mm filter thickness, 240 ms integration time
Algorithm Work • Aerosols (Jun Wang): • Development of a radiative transfer model (RTM) that includes modeling of trace gases, Rayleigh scattering, Aerosol Mie scattering, radiative transfer, etc. • Tests of aerosol retrieval algorithms using AERONET ground data measuring direct and diffuse solar radiance • Trace Gases (Kelly Chance, Xiong Liu): • Much preparation work for GeoTASO done using ACAM data from DISCOVER-AQ • Sensor Effects in data • Fits of slit function and spectral shifts • SNR characterization • Empirical sensor radiometric calibration • Retrieval Studies: • Derivation of reference spectrum to use in retrievals • Finding best spectral fit windows • Investigating direct retrievals of ozone profiles and trace gases
Plans • Sensor functional testing in late June • Sensor test flights at Langley in July • Calibration at Goddard (common cal to ACAM) after test flights • Data collection flights in September in conjunction with DISCOVER-AQ in Houston • Validation of retrieval performance using comparison with other DISCOVER-AQ measurements (ground-based and airborne) B200 w/ACAM: 26 kft, 140 m/s HU-25C w/GeoT: 40 kft, 230 m/s Example of ACAM-based NO2 retrieval compared with Pandora