Download
1 / 53
560 likes | 786 Vues
Effective Liquidity Risk Measurement and Management. Leonard Matz. Effective Liquidity Risk Measurement. Common liquidity metrics: strengths and weaknesses Cash flow projections Scenarios. Loan to Deposit Ratio (South Africa).

E N D
Effective Liquidity Risk Measurement and Management Leonard Matz
Effective Liquidity Risk Measurement • Common liquidity metrics: strengths and weaknesses • Cash flow projections • Scenarios
The Venerable, Oft Quoted and Almost Meaningless Loan to Deposit Ratio • Assumes that all sources of funding other than deposits are stable • Assumes that all deposits are unstable • Assumes that all assets other than loans are completely liquid • Assumes that all loans are completely illiquid
Lots of Ratios Measure Relationships of Liquid, Illiquid, Stable, and Volatile Balance Sheet Volumes • Large liability dependence ratios • Various ratios of liquid assets to purchased funds
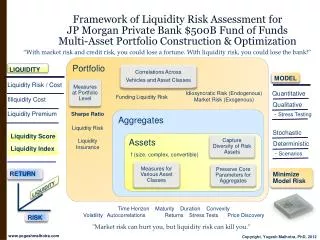
Net Liquid AssetsBalance Sheet Liquidity Model Volatile Liquid Net Liquid Assets Illiquid Stable ASSETS LIABILITIES
Traditional Liquidity MeasuresLeave Much to Be Desired • Mainly retrospective – use historical data. • Large and growing off balance sheet commitments are too often excluded. • Fail to capture any of the dynamics. Liquidity needs are not all the same. Sources available to meet those needs are not all the same.
FOUR IMPARATIVES FOR MEASURING LIQUIDITY • The quantity of liquidity you have or can get MUST be related to the quantity of liquidity that you think you may need. • The quantity of liquidity that you need is, mainly, the sum of current liabilities you may lose plus new assets you may have to fund. • Liquidity risk, the amount of liquidity you might need, is HIGHLY scenario specific. Liquidity cannot be intelligently measured without using scenario analysis. Scenarios are the language or risk measurement. • The quantity of liquidity available is scenario specific. Sources available in some scenarios are less available or unavailable in others.
Liquidity Cash Flow Projection Analysis The essence of liquidity risk is cash flow. Therefore, fundamentally, liquidity gap analysis is simply an evaluation of the two requirements: "enough money" and “when we need it".
Rate Risk vs. Liquidity Risk Gap analysis is notvery well suited for capturing interest rate risk. Gap analysis works much better as a tool for capturing liquidity risk.
Problem: Both Cash Availability And Needs Are Highly Correlated with Scenarios • Cash availability: • asset liquidity • unused funding capacity • Needs: • deposit withdrawal • undrawn credit facility drawdown • collateral pledging
BIS Recommends Scenario Analysis “A bank should analyze liquidity utilizing a variety of ‘what if’ scenarios.” BIS: “Sound Practices For Managing Liquidity in Banking Organizations”, February 2000.
KEY ISSUE Scenarios are far more important to liquidity risk measurement and management than for credit risk, rate risk or operational risk !!!! • The range of potential liquidity risk scenarios is far more varied than scenarios for other financial risks. • Tactics that work in some scenarios are unavailable or constrained in other scenarios.
1987 1990 1991 1992 1994 1995 1997 1998 1999 2000 2001 2002 U.S. stock market crash collapse of U.S. high yield (junk) bond market oil price surge ERM (European Exchange Rate Mechanism) crisis U.S. bond market crash Mexican Crisis Asian crisis Russian default, Ruble collapse. LTCM gold prices TMT (telecommunications, media & technology ) sector collapse September 11 payments system disruption Argentine crisis Systemic Crises – A Wide Variety
IMF finds numerous problems “A review of the experiences since 1980 of the 181 current Fund member countries reveals that 133 have experienced significant banking-sector problems at some stage during the past fifteen years (1980-1995) Source: Lingren, G.J., Garcia, and N. Saal, Banks Soundness and Macroeconomic Policy, Washington DC, IMF, 1996
Use At Least Three Scenarios Normal course of business, including any seasonal fluctuations Bank specific funding crisis Systemic liquidity crisis
Scenarios Monitored By A Large International Bank • Market Risk • Emerging Markets • Systemic Shock • Global Prolonged Recession • Operational Risk • Merger & Acquisition • Downgrade to A1/P1 & A1/A+ • Downgrade to A2/P2 & A3/A- Scenario analysis External Internal “Stress”
Define Three Characteristics For Each Scenario • Type: systemic or bank specific; local, national or international • Duration: short or long • Severity: mild or severe
Scenario Results • Determine total Liquidity Mismatch for each scenario Going Squeeze Specific General Balance sheet +54 +30 -22 -44 Credit lines 0 0 -10 -10 Collateral +30 +27 +26 +15 Gap -6-39 Additional measures needed Source: Bruce McLean, Forrest, UBS
Effective Liquidity Risk Management • Management tactics • Limits, management and reporting • Stress testing
Liquid Assets Volatile Liabilities Liquid Assets Volatile Liabilities Core Assets Structural Liquidity Deficit Core Assets Structural Liquidity Deficit Core Funding + Equity Core Funding + Equity Adding Liquid Assets – A Right Way and a Wrong Way
Beyond Liquid Assets • Loans can also provide liquidity value • Mortgages as collateral for borrowings • Salable and securitizable assets where bonds have not yet been issued • A $1 reduction in liquidity risk is just as good as a $1 increase in liquid assets holdings. • Do not have to hold liquid assets, therefore saves the cost In practice, it depends on the scenario and stress level. When is an asset liquid? When is a liability volatile?
Asset Management: The Three Ss • Syndication • Early warning system • Pricing & participation % • Recent credit concerns • Securitization • All tangible bank assets can be securitized • What about residuals & equity pieces? • Sales Source: Fred Poorman, BNK Analytics
Asset Securitizations “Picking only the low-hanging fruit leaves a very illiquid balance sheet remaining!” Source: Carl Tannenbaum, ABN Ambro
Planned Responses to A Crisis:Asset Management • Rank all assets by how quickly and easily they can be sold • Start preparations for loan sales or securitizations • Maintain primary and secondary liquidity from assets warehouses • Manage pledging to free up excess collateral • Manage pledging to use the least readily salable assets
By Far The Most Common Answer: OKAY, BUT …Every banker knows that if he has to prove that he is worthy of credit, however good may be his arguments, in fact his credit is gone.”Walter Bagehot “Our Plan is Draw Down Our Committed Lines” THE WELL PREPARED NEED BETTER PLANS
Sometimes We Can Borrow. Sometimes Not.Wholesale Funds Providers Are Brutal Arbiters of Creditworthiness • Quickly recognize potential problems • Respond rapidly
Managing Funding Sources • Rank, measure, manage for both current needs and for contingent needs. • Encourage funding from more sticky sources. • Monitor borrowing spreads – not unused borrowing commitments. • Take advantage of market conditions to lengthen maturities when possible. • Maintain an appropriate amount of time deposits and borrowing with remaining lives greater than 90 days, 180 days and one year.
Very Sensitive to Perceived Deterioration in Credit Quality or Safety money market mutual funds rating sensitive providers pension funds insurance companies other funds providers with fiduciary responsibility broker/dealers regional and money center banks in your country foreign banks large corporations community banks in your market area Only sensitive to credit quality and liquidity when problems are very bad and highly publicized. local, uninsured, unsecured depositors customers who are net borrowers (their loan balances exceed their deposit balances) local, secured funds providers insured depositors Sensitivity of Funds Providers By Type
Managing Funding Sources Key Issue: Few, if any, liquidity risk management tactics are more vital than managing the time profile of maturing liabilities. Un-matured time deposits and borrowings are one of the most stable sources of funding in the event of a funding problem.
Four Essential Liquidity Management Tools • Always keep some asset liquidity reserves. This is the insurance cost of liquidity management. But recognize that you cannot and do not want to hold enough for a catastrophe. • Extend liability terms to reduce liquidity risk. • Be prepared to enhance liquidity quickly at the first signs of increased potential need. • Manage cash flow profiles.
Key Considerations for Setting Limits • Not so big as to be meaningless. • Within the bank’s risk tolerance: the cost of put test. • Adjusted for the “path to the exit”. • Must include a “cushion”.
Setting Limits – What Target? • For all scenarios? • For all stress levels? • For the “worst case” of all scenarios and stress levels you evaluate? • For the “most likely” crisis and stress level?
Liquidity Risk Limits Should Apply to Stress Scenarios Banks should analyze the likely impact of different stress scenarios on their liquidity positionand set their limits accordingly. Limits should be appropriate to the size, complexity and financial condition of the bank. Management should define the specific procedures and approvals necessary for exceptions to policies and limits. Source: Paragraph 19, Sound Practices for Managing Liquidity in Banking OrganizationsBasel Committee on Banking Supervision, Basel February 2000
Limits, Guidance and Observation Ratios • Your bank may wish to address all three of these problems by adopting a system that combines a few “hard limits” with “guidance limits” and “observation ratios”. • The hard limits are board approved minimum liquidity coverage ratios. Hard limits may only apply to the time periods in a single scenario at a single level of stress. • Guidance limits can be minimum liquidity coverage ratios for each time period in the scenarios and stress levels not covered by hard limits. The guidance limits may be established by ALCO rather than by the board. Violations of guidance limits may merely require closer monitoring, more frequent reporting and/or additional analysis. • Observation ratios may be for ancillary measures of liquidity risk such as maturity distributions.
Regulatory Approaches Source: Dr. Paul Baneke, De Nederlandsche Bank
Management Report Requirements • Manage the quantity of information. Always use three levels of detail. • Focus on key metrics: • cash flow coverage by time bucket and scenario – compared to limits. • other variables, such as marketable securities, that highlight important needs and sources for your bank. • Periodically supplement with reports for special situations or topics • Always monitor potential key triggers. LIQIDITY IS A CONSUQUENCIAL RISK
A Reporting Dashboard(ratio of projected in-flows to out-flows)
Why Stress Test? BIS Guidelines Require Stress Testing “The liquidity strategy should set out the general approach the bank will have to liquidity, including various quantitative and qualitative targets. This strategy should address the bank's goal of protecting financial strength and the ability to withstand stressful events in the marketplace.” Source: paragraph 7, Sound Practices for Managing Liquidity in Banking OrganizationsBasel Committee on Banking Supervision, Basel February 2000
Why Stress Test? Holding Liquidity is Not Free • No bank can hold enough liquidity to survive anything close to a “worst case” liquidity crisis. • The penalty for too little liquidity may be the failure of the bank but too much liquidity carries a penalty as well. Optimal management of liquidity requires a delicate balance between liquidity risk and income.
Volatility of Savings Deposits The good news: The bank has not experienced a severe loss of deposits. The bad news: The historical observations tell us NOTHING about a future stress environment. Red lines indicate 2 SD
Measurement and Quantification Conclusions • Historical observation does not necessarily reflect what might happen (future events) • Modelling a (fat tail) distribution does not solve the problem either: • Outlying point or fat tail? • Risk is not linear in extreme events • The Question is not: ‘What Risk will we get if we push out the quantiles?’ – The answer to that question is only a matter of scaling and is therefore meaningless! • Instead, the question is: ‘Is there a structural change that the bank should model?’ Adapted from material developed by Dr. Robert E Fiedler