Download
1 / 14
140 likes | 246 Vues
CREATING A SECURE, SUSTAINABLE ENERGY FUTURE. Brazilian American Chamber of Commerce Brazil Summit April 18th, 2011. DISCLAIMER. FORWARD-LOOKING STATEMENTS: DISCLAIMER

E N D
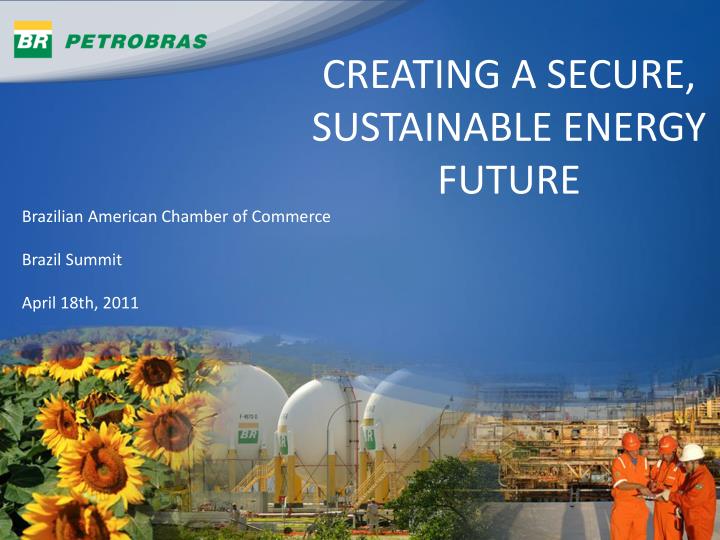
CREATING A SECURE, SUSTAINABLE ENERGY FUTURE Brazilian American Chamber of Commerce Brazil Summit April 18th, 2011
DISCLAIMER FORWARD-LOOKING STATEMENTS: DISCLAIMER The presentation may contain forward-looking statements about future events within the meaning of Section 27A of the Securities Act of 1933, as amended, and Section 21E of the Securities Exchange Act of 1934, as amended, that are not based on historical facts and are not assurances of future results. Such forward-looking statements merely reflect the Company’s current views and estimates of future economic circumstances, industry conditions, company performance and financial results. Such terms as "anticipate", "believe", "expect", "forecast", "intend", "plan", "project", "seek", "should", along with similar or analogous expressions, are used to identify such forward-looking statements. Readers are cautioned that these statements are only projections and may differ materially from actual future results or events. Readers are referred to the documents filed by the Company with the SEC, specifically the Company’s most recent Annual Report on Form 20-F, which identify important risk factors that could cause actual results to differ from those contained in the forward-looking statements, including, among other things, risks relating to general economic and business conditions, including crude oil and other commodity prices, refining margins and prevailing exchange rates, uncertainties inherent in making estimates of our oil and gas reserves including recently discovered oil and gas reserves, international and Brazilian political, economic and social developments, receipt of governmental approvals and licenses and our ability to obtain financing. We undertake no obligation to publicly update or revise any forward-looking statements, whether as a result of new information or future events or for any other reason. Figures for 2010 on are estimates or targets. All forward-looking statements are expressly qualified in their entirety by this cautionary statement, and you should not place reliance on any forward-looking statement contained in this presentation. NON-SEC COMPLIANT OIL AND GAS RESERVES: CAUTIONARY STATEMENT FOR US INVESTORS We present certain data in this presentation, such as oil and gas resources, that we are not permitted to present in documents filed with the United States Securities and Exchange Commission (SEC) under new Subpart 1200 to Regulation S-K because such terms do not qualify as proved, probable or possible reserves under Rule 4-10(a) of Regulation S-X.
World Brazil PRIMARY DEMAND FOR ENERGY – BREAKDOWN BY RENEWABLE FUEL 2008 2030 16.725 (MM TOEs) 12.271 (MM TOEs) 2008 2030 245 (MM TOEs) 572 (MM TOEs) 3 Source: International Energy Agency for 2008 and Petrobras projections - sustainable development scenario for 2030.
Coal Coal Nuclear Nuclear World 8% Gas Gas 26% Oil Oil 21% 2% 3% 6% 9% 29% 9% Brazil 11% 39% 31% PRIMARY DEMAND FOR ENERGY – BREAKDOWN BY NONRENEWABLE FUEL Average Annual Growth 6% +2,7% a.a. 27% +1,3% a.a. 21% +1,4% a.a. +0,8% a.a. 33% 2008 2030 Average Annual Growth +7,1% a.a. +6,0% a.a. +5,1% a.a. +2,9% a.a. 4 2008 2030 Source: International Energy Agency for 2008 and Petrobras projections - sustainable development scenario for 2030.
MAIN TRANSPORTATION SECTOR ENERGY CONSUMPTION Accelerating Growth of Brazilian Fuel Consumptionl +39% +8% Million Bep * * Considers gasoline plus anhydrous ethanol Source: ANP • From 2000 to 2009, gasoline consumption increased 12%, while ethanol 258%; • Diesel consumption up 40%, with bio-diesel equal to 5% of diesel consumption; • Jet fuel consumption has increased 30% in just the last five years 5
INCREASE THE DEMAND FOR “FLEX FUEL” VEHICLES Evolution of Demand for Vehicles Related to Fuel Used Type Thousand units Gasoline NGV Electric Vehicle Source: MME – Brazlian Energy Balance 2010 • Flexfuel non-existent in 2005, grew to half the vehicle fleet in seven years; • Total vehicles to more than triple by 2030 6
2010 Production/Consumption of Oil 98,1% CONSUMPTION & PRODUCTION (2) (1) (1) 2006-10: estimated Brazilian oil consumption based on Petrobras sales of oil products (2) Anhydrous and hydrous ethanol. Considering: 1m3 = 6,2898 bbl. Source: EPE – Mines and Energy Ministry • Without ethanol sales substituting gasoline consumption, Brazil would still be a net importer of oil products 7 Source: Stanford; PIW
HISTORICAL OIL PRODUCTION • Brazil has became self sufficient in oil through its deepwater offshore discoveries; • No growth in demand for 20 years, following oil shocks and low growth; • Accelerating demand with growing economy and rising incomes 8
EVOLUTION OF NATURAL GAS CONSUMPTION IN BRAZIL SINCE 2000 Natural Gas Consumption by Sector Thousand m3/day 9% OTHERS* 25% ELECTRICITY GENERATION 2% RESIDENTIAL 11% TRANSPORTATION (NGV) 53% INDUSTRY * Includes commercial, cogeneration and compressed natural gas • Strong growth of the natural gas consumption in Brazil since 2000 (+208%); • Hydro-electric creates volatility in demand, but gas fired thermo electric should increase over time • Vehicular natural gas now equivalent to 30 thousand BPD, or 10% of gasoline sales 9 Source: Abegás
Oil & gas production growth in a sustainable manner that will approximately double our production in the next 10 years ü Focus in oil, oil products, petrochemicals, gas & energy, biofuels, refining and distribution with an integrated and sustainable business model ü Consolidate leadership in the Brazilian market of natural gas, electricity generation and gas chemicals ü E&P RTM G&P Petrochemicals BUSINESS PLAN 2010-14: INCREASED INVESTMENT FOR INTEGRATED OPERATIONS IN BRAZIL Petrobras’ Corporate Strategy to 2020 Total Capital Investment Plan 2010-2014 US$ 224.1 billion Integrated Growth, Profitability and Sustainability Distribution Biofuels Corporate Be recognized as a benchmark among integrated energy companies 10
29,000-31,000 15,986 14,913 12,131 Total Resource Base Proven Reserves 2005 Proven Reserves 2010 Proven Reserves 2002 GROWING PRODUCTION FULLY SUPPORTED BY DISCOVERIES Petrobras Total Production (000 b/d) 5,382 7.6% CAGR 4.5% p.y. 3,907 2,583 2,217 1,809 1,078 Pre-Salt 241 ... ... Petrobras Total Reserves (bln boe) - SPE Criteria 5,000 • 18th consecutive years of fully replacing the production (229% in 2010) • R/P ratio 18.4 years (SPE Criteria) Higher Estimates 9,600 Lower estimates 8,100 Potential Recoverable (Lula, Cernambi, Iara, Guará and Whales Park) Transfer of Rights 11
3 FROM A DOWNSTREAM COMPANY, PETROBRAS BECAME AN INTEGRATED AND BALANCED COMPANY Throughput Production Oil Product Demand Petrobras has a unique in its downstream business since it is almost the sole operator in its fast growing domestic market. Brazilian market has a continental scale in size 124% Production as a % of refining 132% 110% 13% kbpd 2009 1980 2020E 2014E • Oil Production and the Brazilian market demand currently exceed refining capacity • By 2014, exports are projected to reach nearly 1 million bpd, even as refining capacity is expanded to process Brazilian production to meet demand 12
+193% ETHANOL BIO DIESEL BIOFUEL TARGETS AND INVESTMENTS 2010-2014: CONTINUED EXPANSION AND INTEGRATION WITH OIL PRODUCTS Strategy Act globally, on biofuels production, with relevant participation in biodiesel and ethanol bussiness Production Capacity of Biodiesel in Brazil Ethanol Exports Ethanol Production +47% +135% Thous. m³/year • Ethanol • Increase of Petrobras participation in Brazil's ethanol industry and bioenergy; investments focus on developing a new generation of biofuels and cogeneration power: • Acquisition of 45.7% of Guarani, the 4th largest processor of sugar cane in the country, and agreement to reach a stake of up to 49%; • Acquisition of 40.4% of Usina Total; • Strategic partnership with Grupo São Martinho, creating a new company, called Nova Fronteira (49% BR). INVESTMENTS 2010-2014: US$ 3.5 Billion 13 13