2010 Water Year Review: Precipitation and Temperature Patterns in Upper Colorado
This report reviews the water year 2010, detailing precipitation and temperature trends from January to December across the Upper Colorado, San Juan, and Rio Grande river basins. Notable findings include below-normal temperatures in May and significant variations in reservoir storage. Observations indicate a delayed melt and its impacts on seasonal volumes, particularly affecting river flows in the Roaring Fork and Yampa Rivers. Proposed solutions aim to improve modeling accuracy for future flood predictions.


2010 Water Year Review: Precipitation and Temperature Patterns in Upper Colorado
E N D
Presentation Transcript
Water Year 2010Review CBRFC Open House August 17, 2010
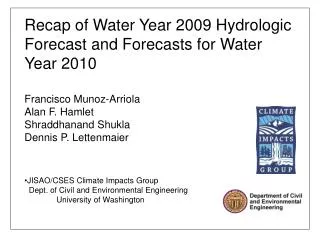
January 1, 2010 Green Green Green Upper Colorado Upper Colorado San Juan Rio Grande San Juan Upper Colorado San Juan
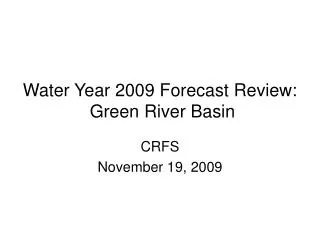
June 1, 2010 June 1, 2010 Snow Water Equivalent
327 KAF 98% avg
139 KAF 83% avg
2175 KAF 90% avg
488 KAF 57% avg
494 KAF 69% avg
247 KAF 77% avg
654 KAF 83% avg
5795 KAF 73% avg
Fontenelle Reservoir 1991-2008 - 19% 2010 – 20% Eagle-Gypsum 1991-2008 - 16% 2010 – 33% Dillon Reservoir 1991-2008 - 20% 2010 – 14% Colorado-Cameo 1991-2008 - 15% 2010 – 15% Blue Mesa Reservoir 1991-2008 - 15% 2010 – 20% McPhee Reservoir 1991-2008 - 21% 2010 – 5% Navajo Reservoir 1991-2008 - 13% 2010 – 8% Lake Powell 1991-2008 - 17% 2010 – 14%
Some Observations (Craig) • 7 days of high flow (6/6-6/13) • Near normal/below normal seasonal precipitation • Below Normal temperatures in May (slightly below in April) • Melt was delayed • Season volumes affected somewhat • Seen on: • Roaring Fork • Eagle • Uncompahgre (a little) • Granby (a little) • Yampa • Big/Little Cottonwood • Headwaters of Provo/Weber/Bear/Uinta streams • Did not affect • Gunnison/San Juan Rivers • Blue • Upper Green
Possible Reasons • Possible Input errors • Precipitation • Temperature • Fixes for the future • Running model in calibration mode showed similar errors • Known SNOW-17 low bias in rapid melt situations • Temperature index model • Melt of snow probably was atypical • Model is split by elevation zones not aspect • Significantmelt in May in exposed areas • Delay of melt in colder, less exposed areas • Hypothesis: North facing lower level melted at same time as south facing high level • Not captured by SNOTEL network or model • Similarerror in one other year (1984)
Possible Solutions • Areal Extent updates • Distributed models • Late melt = flooding potential