Download
1 / 33
340 likes | 957 Vues
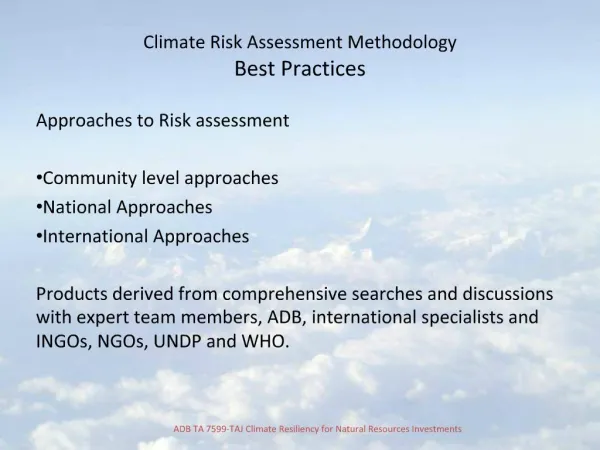
A Systematic Methodology for Holistic Risk Assessment in Asset Management. John Mo Manufacturing and Materials Engineering RMIT University Ph: 03 9925 6279 or Em: john.mo@rmit.edu.au. Outline of Presentation. Risks in asset management The change process and holistic approach

E N D
A Systematic Methodology for Holistic Risk Assessment in Asset Management John Mo Manufacturing and Materials Engineering RMIT University Ph: 03 9925 6279 or Em: john.mo@rmit.edu.au
Outline of Presentation • Risks in asset management • The change process and holistic approach • Analytic Hierarchy Process • Internal quantifiable factors • External non-quantifiable factors • A worked example
Risk Issues in Asset Management • Long service life • Changes in external factors, e.g. climate change, market, supply and distribution networks • Changes internal factors, e.g. production, loss time, organisations
Commercial off the shelf tools • The COTS tools partially address the risk management issues & challenges in asset management • No COTS tools completely meet the baseline requirements • Critical limitations of COTS tools for asset management applications: • Knowledge management: inability to capture and reuse organisation knowledge in order to formulate better mitigation plans • Risk propagation analysis: fails to consider the propagation of risks based on their interdependencies • Quantitative risk analysis: highly dependent on user judgements resulting in inconstant risk analysis • Treating incomplete information: inability to compute risk likelihood using incomplete information
Difficulties in Asset Management Decisions • Many factors are non-quantifiable • Major decisions such as replacement, upgrade, overhaul should be based on optimising business performance • Effective decision making needs a single value indicator that combines other indicators in a logical way
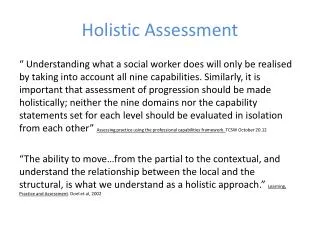
Holistic Approach • All factors considered • Multi-criteria, capable of handling large number of factors • Deal with both quantitative and qualitative data • Systematic, unbiased methodology • Analytic hierarchy process (AHP) has been used in many areas in business enterprises for priority setting, resource allocation, decision making • The process is to be supported by quantitative means wherever it is possible
Analytic Hierarchy Process Collect the facts Pairwise comparison Normalise to Vector of priorities Define the hierarchy Compute overall vector of priorities Establish criteria
AHP Structure for Asset Management Decisions Asset performance indicator Level I System reliability Production capacity Customer satisfaction Frequency of power failures Level II (Large no. of factors) Enterprise activity under existing asset conditions Enterprise activity under new asset conditions Level III
Pairwise Comparison • For each factor, compare two states to determine the relative importance • Internal factors are often quantifiable. For quantifiable factors, use available numerical values • Actual production data • Historical failure rates • Test results • Sales or marketing data
Reliability Data Comparison Available time for old asset per year = 6132 hrs Anticipated available time for new asset per year = 7800 hrs Invert from cell (1,2)
Vector of Priority • To address inconsistency in dimensions, units of measurement, importance or criticality • Computed by normalising the factors for both old and new asset conditions
Compute Vector of Priority 1.786___ (2.272+1.786) 2.272___ (2.272+1.786)
CAPEX (Negative Factor) CAPEX for old asset = $0.1M Anticipated CAPEX for new asset = $1.0M
External factors • External factors are often non-quantifiable. They are often uncontrollable. • For non-quantifiable factors, use expert judgement: • Customer satisfaction • Competition • Market share
Extremely preferred/favourable Very strong to extremely Very strongly preferred/favourable Strongly to very strongly Strongly preferred/favourable Moderately to strongly Moderately preferred/favourable Equally to moderately Equally preferred/favourable 9 8 7 6 5 4 3 2 1 Define the scale of comparison
Pairwise Comparison of Customer Satisfaction Customer preference: Old asset is moderately preferred than new asset
Pairwise Comparison of Insurance Premium No perceived change of insurance premium
Weighting of Governing Factors • To distinguish the importance of some factors as compared to another in the context of the business (asset to be managed) • Pairwise comparison and then normalised in much the same way
Overall Vector of Priority Benefit indicator:
Summary • Many other factors are also governing the operation of the asset • Some of these factors are non-quantifiable • Major decisions such as replacement, upgrade, system overhaul are risk sensitive • The existing and new asset conditions can be analysed as a transition from AS-IS state to TO-BE state by Analytic Hierarchy Process • AHP can take both quantitative and non-quantifiable factors together in an equitable way • Internal factors are mostly quantitative factors • External factors are generally non-quantifiable factors. They are analysed by expert judgement • This holistic risk approach can convert all factors into a single indicator value assisting decision making on asset management
A Word of Caution • Like any risk analysis, there is always a factor of uncertainty • The indicator should be used as a reference for decision making, rather than dictating the outcome of the decision • More expert involvement will give a fairer judgement on non-quantifiable factors
Thank youQuestions? Professor John Mo Discipline Head, Manufacturing and Materials Engineering RMIT University Building 251, Bundoora East Campus, Bundoora, VIC 3083 Contact: 03 9925 6279 or john.mo@csiro.au