Download
1 / 33
330 likes | 439 Vues
Northeast TB Controllers Meeting Princeton, New Jersey October 24, 2006. Epidemiology of Tuberculosis in Northeastern United States, 1993-2005. Kenneth G. Castro, M.D. Assistant Surgeon General, USPHS Director, Division of Tuberculosis Elimination

E N D
Northeast TB Controllers Meeting Princeton, New Jersey October 24, 2006 Epidemiology of Tuberculosis in Northeastern United States, 1993-2005 Kenneth G. Castro, M.D. Assistant Surgeon General, USPHS Director, Division of Tuberculosis Elimination National Center for HIV, Hepatitis, STD, and TB Prevention* Coordinating Center for Infectious Diseases * Proposed
Acknowledgements • United States TB controllers, state and local health departments • CDC, DTBE, SEOIB and FSEB • Lori Armstrong − Sandy Althomsons • Elvin Magee − Val Robison • Tom Navin − Dave Crowder • Dan Ruggiero − John Jereb • Mark Lobato − Margaret Oxtoby • Edwin Rodriguez − Tracy Agerton • Farah Parvez − Sonal Munsiff • Vernard Green − Tom Privett • Zach Taylor
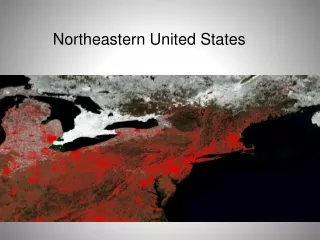
TB Cases Analyzed • National TB Surveillance System • Reported 1993 to 2005 • Northeastern States: Maine, New Hampshire, Vermont, Connecticut, Massachusetts, Rhode Island, New York, New Jersey • Compared to all other states in the U.S.
TB Case Rates,* United States, 2005 NE states D.C. < 3.5 (year 2000 target) 3.6–4.8 > 4.8 (national average) *Cases per 100,000.
Reported TB Case Rates in U.S.,NE vs. Other States, 1993-2005 Rate TB Cases/ 100,000 Year
Reported TB Cases by Age Group, NE States vs. Others, 1993–2005 Percent of Case Count
Reported TB Cases by Race/Ethnicity,*NE States vs. Others, 1993–2005 Amer Indian/Nat Alaskan (<1%) Amer Indian/Nat Alaskan (1%) Nat Hawaiian/Pacific (<1%) White (18%) Asian (20%) Asian (19%) White (25%) Nat Hawaiian/Pacific (<1%) Hispanic (25%) Black (36%) Black (31%) Hispanic (23%) Other States NE States *All races are non-Hispanic. Persons reporting two or more races accounted for less than 1% of all cases. Unknown not included.
Reported TB Cases by Birth Origin,NE States vs. Others, U.S., 1993–2005* Note: Unknown not included
TB Cases, by Previous Diagnosis, NE States vs. Others, U.S., 1993–2005* Note: Unknown and missing not included *Updated as of March 29, 2006.
HIV Test Results of TB Cases,NE States vs. Others, U.S., 1993–2005*
Mode of Treatment Administration in Persons Reported with TB,NE States vs. Others, U.S., 1993–2003* * Excludes unknown and missing. Directly observed therapy (DOT); Self-administered therapy (SA)
Percent Completion of TB Therapy,* NE States vs. Others, U.S., 1993-2005 Percent Year *Healthy People 2010 target: 90% completed in 1 yr or less.Note: Excludes persons with initial isolate resistant to rifampin and children <15 years old with meningeal, bone or joint, or miliary disease excluded.
Reason Therapy Stopped in TB Cases, NE States vs. Others, U.S., 1993–2005* Percent
MDR TB* in NE States vs. Others,U.S., 1993-2005 % MDR TB Year of Reporting %MDR TB cases = no. of TB cases with Mycobacterium tuberculosis isolates resistant to isoniazid and rifampin, among all cases tested to isoniazid and rifampin
MDR TB by Birth Origin, NE States vs. Others, U.S., 1993-2005
TB Epidemiology Summary in NE States* • Heterogeneous states (high, medium, low incidence) • Consistently higher rates • Majority (58.6%) younger than 44 years • Most (82%) racial/ethnic minorities • Lower proportion (49.2%) U.S.-born • Higher prevalence (19.2%) HIV infection • Larger proportion on DOT+SA and SA only treatment • COT improving (82%), room for improvement • MDR decreased 1993-2000, recent stagnation * Compared with other states, U.S., 1993-2005
Second-Line Drug Classes for MDR TB Treatment Aminoglycosides Amikacin, Kanamycin Polypeptides Capreomycin Fluoroquinolones Ciprofloxacin, Ofloxacin First line drugs + Thioamides Ethionamide, Prothionamide Serine analogues Cycloserine PAS WHO. Guidelines for the programmatic management of drug-resistant tuberculosis. 2006.
Characteristics of KZN XDRTB Patients Characteristics No. (%) • No prior TB Treatment 26 (51) • Prior TB treatment • Cure or Completed treatment 14 (28) • Treatment Default or Failure 7 (14) • HIV-infected (44 tested) 44 (100) • Dead (Includes 34% on ARV) 52 (98) • Identical M. tb spoligotype 26/30 * Moll A, Gandhi NR, Pawinski R, Lalloo U, Sturm AW, Zeller K, Andrews J, Friedland G. HIV associated Extensively Drug-Resistant TB (XDR-TB) in Rural KwaZulu-Natal (South Africa MRC Expert Consultation Sept 8, 2006)
HIV-related MDR TB Outbreak Investigations by CDC & Health Departments, USA, 1988–92
U.S. Response to TB Resurgence Updated Diagnostic Labs, Real-time Drug Resistance, & Strain Fingerprinting National MDR-TB Action Plan & New Resources Improved Case Identification & Training Rebuilt Research Capacity DOT & Improved Rx Completion Updated Infection Control and Rx Recommendations AJRCCM 1994;149:1359-74
Global 7-point Action Plan to Combat XDR TBEmphasizes Essentials of Proper TB Control • Conduct rapid surveys of XDR-TB (determine burden) • Enhance laboratory capacity (emphasis on rapid DST) • Improve technical capacity of clinical and public health practitioners to effectively respond to XDR-TB outbreaks and manage patients • Implement infection control precautions (PLHA focus) • Increase research support for anti-TB drug development • Increase research support for rapid diagnostic test development • Promote universal access to ARVs under joint TB/HIV activities MRC Consultation, Johannesburg, South Africa. Sept 7, 2006
Revised WHO Case Definition for XDR TB (Oct 10, 2006) Goals • Public health surveillance • Reliable DST methodology • Clinical relevance • Relatively simple Resistance to at least isoniazid and rifampin (MDR) plus resistance to fluoroquinolones and one of the second-line injectable drugs (amikacin, kanamycin, or capreomycin)
TB Treatment Outcomes, by Selected Drug Resistance Patterns, Latvia, 2000-2003* Percent * Leimane V, et al. WHO XDR TB Task Force Meeting. Oct 9, 2006(from N = 820 evaluated)
XDR(WHO) TB Cases in U.S.,Northeast vs. Other States, 1993-2005 No. XDR TB Cases Year of Report
XDR(WHO) TB Cases in U.S.,Foreign-born vs. U.S.-born, 1993-2005 No. XDR TB Cases Year of Report
XDR(WHO) TB Cases in Northeast States, Foreign-born vs. U.S.-born,1993-2005 No. XDR TB Cases Year of Report
XDR(WHO) TB Cases in Other States, Foreign-born vs. U.S.-born,1993-2005 No. XDR TB Cases Year of Report
XDR(WHO) TB Cases in U.S.-born vs. Foreign-born Persons, 1993-2005
TB Clinical Development Pipeline Diarylquinoline TMC207 Nitroimidazo-oxazole OPC-67683 Nitroimidazole PA-824 Pyrrole LL-3858 *Institut de Recherche pour le Developement World Health Organization, Tropical Disease Research Centers for Disease Control and Prevention Novel compounds, highlighted in blue boxes, are active against MDR/XDR TB
Microscopic-Observation Drug Susceptibility Assay for the Diagnosis of TB* Moore DAJ, et al. N Engl J Med 2006;355:1539-50
Actual and BRDPI-Adjusted Federal Funds for TB*, CDC, 1990-2006 Actual $ BRDPI Adjusted * Adjusted to 1990 US$ by Biomedical Research & Development Price Index ** Includes TB/HIV and lab dollars