Download
1 / 2
80 likes | 451 Vues
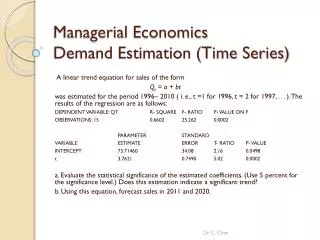
Managerial Economics Demand Estimation (Time Series). A linear trend equation for sales of the form Q t = a + bt was estimated for the period 1996– 2010 ( i. e., t =1 for 1996, t = 2 for 1997, . . . ). The results of the regression are as follows:

E N D
Managerial Economics Demand Estimation (Time Series) A linear trend equation for sales of the form Qt = a + bt was estimated for the period 1996– 2010 ( i. e., t =1 for 1996, t = 2 for 1997, . . . ). The results of the regression are as follows: DEPENDENT VARIABLE: QT R- SQUARE F- RATIO P- VALUE ON F OBSERVATIONS: 15 0.6602 25.262 0.0002 PARAMETER STANDARD VARIABLE ESTIMATE ERROR T- RATIO P- VALUE INTERCEPT 73.71460 34.08 2.16 0.0498 t 3.7621 0.7490 5.02 0.0002 a. Evaluate the statistical significance of the estimated coefficients. (Use 5 percent for the significance level.) Does this estimation indicate a significant trend? b. Using this equation, forecast sales in 2011 and 2020. Dr. C. Chen
Managerial Economics Demand Estimation (Time Series) A linear trend equation for sales of the form Qt = a + bt was estimated for the period 1996– 2010 ( i. e., t =1 for1996, t = 2 for1997, . . .). The results of the regression are as follows: DEPENDENT VARIABLE: QT R- SQUARE F- RATIO P- VALUE ON F OBSERVATIONS: 15 0.6602 25.262 0.0002 PARAMETER STANDARD VARIABLE ESTIMATE ERROR T- RATIO P- VALUE INTERCEPT 73.71460 34.08 2.16 0.0498 t 3.7621 0.7490 5.02 0.0002 a. Evaluate the statistical significance of the estimated coefficients. (Use 5 percent for the significance level.) Does this estimation indicate a significant trend? The p-value of t-test is 0.0002<0.05. The trend significance is confirmed. The p-value of F-test is also less than 0.05, we can apply the model for future period prediction. b. Using this equation, forecast sales in 2011 and 2020. Year 2011 (t =16), Q = 73.7146 + 3.7621(16) = 133.9082 Year 2020 (t =25), Q = 73.7146 + 3.7621(25) = 167.7671 Dr. C. Chen