Download
1 / 25
250 likes | 259 Vues
Global saline agriculture market is anticipated to project a robust growth in the forecast period, 2016-2026 with an impressive CAGR value on the account of increasing demand for the food crops. Rapidly increasing global population and the demand to supply food to everyone is further driving the growth of the global saline agriculture market in the upcoming five years. https://bit.ly/31B0aY8

E N D
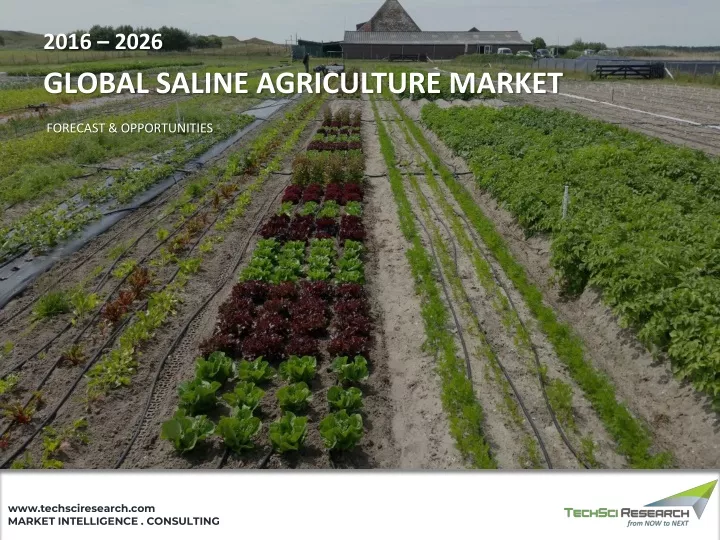
2016 – 2026 GLOBAL SALINE AGRICULTURE MARKET FORECAST & OPPORTUNITIES www.techsciresearch.com MARKET INTELLIGENCE . CONSULTING
Scope of Report Product of Interest (POI): Saline Agriculture The process of using saline water to irrigate crops on salt soils is termed as saline agriculture. If salt sensitive plants are grown on saline soils, the plant incurs severe effect of saline water. The salt sensitive plants suffer affects of salt injuries like burning of leaf margins, stunt growth of the plants, wilting and in severe cases, death. Saline agriculture is done with the fact in mind that only plants that have the ability to uptake water from the saline soils, and demand nutrients like sodium, chloride or sulfate are grown on the lands inflicted with soil. Before the agricultural practices were conducted on the saline soils, diagnostic and measuring tests are conducted to find the levels of salt in the soil and their effects on the plants. Market Segmentation WATER SOURCE REGION Year Range Seawater Asia-Pacific • • Brackish Water Europe • • Historical Data Sewage North America • • Others South America • • 2016 – 2019 Middle East & Africa • Base Year (MEA) TECHNOLOGY 2020 Saltwater Aquaponics • Saltwater Hydroponics • CROP TYPE Estimated Year Saltwater Greenhouse • High Yielding Halophytes • 2021 Others • Oilseeds • Fuel Wood & Timber • Forecast Period Others • CROP TYPE 2022 – 2026 High Yielding Halophytes • Oilseeds • Fuel Wood & Timber • Others • 2
Table of Contents S. No. Contents Page No. 1. Product Overview (Definition of Product Type and major terminologies used in the report) Research Methodology (Detailed description of the methodology used to conduct the research, Raw data backup, list of all secondary sources, List of respondents for primary surveys) 2. 3. Impact of COVID-19 on Global Saline Agriculture Market 4. Executive Summary (This chapter covers summary of the complete study.) 5. Voice Of Customer Global Saline Agriculture Market Outlook, 2016-2026F (This chapter includes a brief overview of the product of interest market such as total market’s growth rate, expected growth rate, key growth levers, leading region, top grossing product types, etc. It includes more of a qualitative information about the market.) 6. 6.1. Market Size & Forecast 6.1.1. By Value 6.2. Market Share & Forecast 6.2.1. By Water Source (Seawater, Brackish Water, Sewage, Others) By Technology (Saltwater Aquaponics, Saltwater Hydroponics, Saltwater Greenhouse, Others) 6.2.2. 6.2.3. By Crop Type (High Yielding Halophytes, Oilseeds, Fuel Wood & Timber, Others) 6.2.4. By Application (Ornamental v/s Environmental Protection) 6.2.5. By Company (2020) 6.2.6. By Region 6.3. Product Market Map 3
Table of Contents S. No. Contents Page No. 7. Asia-Pacific Saline Agriculture Market Outlook 7.1. Market Size & Forecast 7.1.1. By Value 7.2. Market Share & Forecast 7.2.1. By Water Source 7.2.2. By Technology 7.2.3. By Crop Type 7.2.4. By Application 7.2.5. By Country 7.3. Asia-Pacific: Country Analysis 7.3.1. China Saline Agriculture Market Outlook 7.3.1.1. Market Size & Forecast By Value 7.3.1.1.1. 7.3.1.2. Market Share & Forecast 7.3.1.2.1. By Water Source 7.3.1.2.2. By Technology 7.3.1.2.3. By Crop Type 7.3.1.2.4. By Application 4
Table of Contents S. No. Contents Page No. 7.3.2. India Saline Agriculture Market Outlook 7.3.2.1. Market Size & Forecast 7.3.2.1.1. By Value 7.3.2.2. Market Share & Forecast 7.3.2.2.1. By Water Source 7.3.2.2.2. By Technology 7.3.2.2.3. By Crop Type 7.3.2.2.4. By Application 7.3.3. Japan Saline Agriculture Market Outlook 7.3.3.1. Market Size & Forecast 7.3.3.1.1. By Value 7.3.3.2. Market Share & Forecast 7.3.3.2.1. By Water Source 7.3.3.2.2. By Technology 7.3.3.2.3. By Crop Type 7.3.3.2.4. By Application 5
Table of Contents S. No. Contents Page No. 7.3.4. South Korea Saline Agriculture Market Outlook 7.3.4.1. Market Size & Forecast By Value 7.3.4.1.1. 7.3.4.2. Market Share & Forecast 7.3.4.2.1. By Water Source 7.3.4.2.2. By Technology 7.3.4.2.3. By Crop Type 7.3.4.2.4. By Application 7.3.5. Australia Saline Agriculture Market Outlook 7.3.5.1. Market Size & Forecast By Value 7.3.5.1.1. 7.3.5.2. Market Share & Forecast 7.3.5.2.1. By Water Source 7.3.5.2.2. By Technology 7.3.5.2.3. By Crop Type 7.3.5.2.4. By Application 6
Table of Contents S. No. Contents Page No. 8. Europe Saline Agriculture Market Outlook 8.1. Market Size & Forecast 8.1.1. By Value 8.2. Market Share & Forecast 8.2.1. By Water Source 8.2.2. By Technology 8.2.3. By Crop Type 8.2.4. By Application 8.2.5. By Country 8.3. Europe : Country Analysis 8.3.1. France Saline Agriculture Market Outlook 8.3.1.1. Market Size & Forecast By Value 8.3.1.1.1. 8.3.1.2. Market Share & Forecast 8.3.1.2.1. By Water Source 8.3.1.2.2. By Technology 8.3.1.2.3. By Crop Type 8.3.1.2.4. By Application 7
Table of Contents S. No. Contents Page No. 8.3.2. Germany Saline Agriculture Market Outlook 8.3.2.1. Market Size & Forecast By Value 8.3.2.1.1. 8.3.2.2. Market Share & Forecast 8.3.2.2.1. By Water Source 8.3.2.2.2. By Technology 8.3.2.2.3. By Crop Type 8.3.2.2.4. By Application 8.3.3. United Kingdom Saline Agriculture Market Outlook 8.3.3.1. Market Size & Forecast 8.3.3.1.1. By Value 8.3.3.2. Market Share & Forecast 8.3.3.2.1. By Water Source 8.3.3.2.2. By Technology 8.3.3.2.3. By Crop Type 8.3.3.2.4. By Application 8
Table of Contents S. No. Contents Page No. 8.3.4. Italy Saline Agriculture Market Outlook 8.3.4.1. Market Size & Forecast By Value 8.3.4.1.1. 8.3.4.2. Market Share & Forecast 8.3.4.2.1. By Water Source 8.3.4.2.2. By Technology 8.3.4.2.3. By Crop Type 8.3.4.2.4. By Application 8.3.5. Spain Saline Agriculture Market Outlook 8.3.5.1. Market Size & Forecast 8.3.5.1.1. By Value 8.3.5.2. Market Share & Forecast 8.3.5.2.1. By Water Source 8.3.5.2.2. By Technology 8.3.5.2.3. By Crop Type 8.3.5.2.4. By Application 9
Table of Contents S. No. Contents Page No. 9. North America Saline Agriculture Market Outlook 9.1. Market Size & Forecast 9.1.1. By Value 9.2. Market Share & Forecast 9.2.1. By Water Source 9.2.2. By Technology 9.2.3. By Crop Type 9.2.4. By Application 9.2.5. By Country 9.3. North America: Country Analysis United States Saline Agriculture Market Outlook 9.3.1. 9.3.1.1. Market Size & Forecast By Value 9.3.1.1.1. 9.3.1.2. Market Share & Forecast 9.3.1.2.1. By Water Source 9.3.1.2.2. By Technology 9.3.1.2.3. By Crop Type 9.3.1.2.4. By Application 10
Table of Contents S. No. Contents Page No. 9.3.2. Canada Saline Agriculture Market Outlook 9.3.2.1. Market Size & Forecast By Value 9.3.2.1.1. 9.3.2.2. Market Share & Forecast 9.3.2.2.1. By Water Source 9.3.2.2.2. By Technology 9.3.2.2.3. By Crop Type 9.3.2.2.4. By Application 9.3.3. Mexico Saline Agriculture Market Outlook 9.3.3.1. Market Size & Forecast By Value 9.3.3.1.1. 9.3.3.2. Market Share & Forecast 9.3.3.2.1. By Water Source 9.3.3.2.2. By Technology 9.3.3.2.3. By Crop Type 9.3.3.2.4. By Application 11
Table of Contents S. No. Contents Page No. 10. South America Saline Agriculture Market Outlook 10.1. Market Size & Forecast 10.1.1. By Value 10.2. Market Share & Forecast 10.2.1. By Water Source 10.2.2. By Technology 10.2.3. By Crop Type 10.2.4. By Application 10.2.5. By Country 10.3. South America: Country Analysis 10.3.1. Brazil Saline Agriculture Market Outlook 10.3.1.1. Market Size & Forecast By Value 10.3.1.1.1 10.3.1.2. Market Share & Forecast 10.3.1.2.1. By Water Source 10.3.1.2.2. By Technology 10.3.1.2.3. By Crop Type 10.3.1.2.4. By Application 12
Table of Contents S. No. Contents Page No. 10.3.2. Argentina Saline Agriculture Market Outlook 10.3.2.1. Market Size & Forecast By Value 10.3.2.1.1 10.3.2.2. Market Share & Forecast 10.3.2.2.1. By Water Source 10.3.2.2.2. By Technology 10.3.2.2.3. By Crop Type 10.3.2.2.4. By Application 10.3.3. Colombia Saline Agriculture Market Outlook 10.3.3.1. Market Size & Forecast By Value 10.3.3.1.1 10.3.3.2. Market Share & Forecast 10.3.3.2.1. By Water Source 10.3.2.2.2. By Technology 10.3.2.2.3. By Crop Type 10.3.2.2.4. By Application 13
Table of Contents S. No. Contents Page No. 11. Middle East & Africa Saline Agriculture Market Outlook 11.1. Market Size & Forecast 11.1.1. By Value 11.2. Market Share & Forecast 11.2.1. By Water Source 11.2.2. By Technology 11.2.3. By Crop Type 11.2.4. By Application 11.2.5. By Country 11.3. Middle East & Africa : Country Analysis 11.3.1 Saudi Arabia Saline Agriculture Market Outlook 11.3.1.1. Market Size & Forecast By Value 11.3.1.1.1. 11.3.1.2. Market Share & Forecast 11.3.1.2.1. By Water Source 11.3.1.2.2. By Technology 11.3.1.2.3. By Crop Type 11.3.1.2.4. By Application 14
Table of Contents S. No. Contents Page No. UAE Saline Agriculture Market Outlook 11.3.2. 11.3.2.1. Market Size & Forecast By Value 11.3.2.1.1. 11.3.2.2. Market Share & Forecast 11.3.2.2.1. By Water Source 11.3.2.2.2. By Technology 11.3.2.2.3. By Crop Type 11.3.2.2.4. By Application South Africa Saline Agriculture Market Outlook 11.3.3. 11.3.3.1. Market Size & Forecast By Value 11.3.3.1.1. 11.3.3.2. Market Share & Forecast 11.3.3.2.1. By Water Source 11.3.3.2.2. By Technology 11.3.3.2.3. By Crop Type 11.3.3.2.4. By Application 15
Table of Contents S. No. Contents Page No. Kuwait Saline Agriculture Market Outlook 11.3.4. 11.3.4.1. Market Size & Forecast By Value 11.3.4.1.1. 11.3.4.2. Market Share & Forecast 11.3.4.2.1. By Water Source 11.3.4.2.2. By Technology 11.3.4.2.3. By Crop Type 11.3.4.2.4. By Application 12. Market Dynamics 12.1. Drivers 12.2. Challenges 13. Market Trends & Developments 14. Competitive Landscape 14.1. Competition Outlook 14.2. Company Profiles 14.2.1. Company Details 14.2.2. Products & Services 14.2.3. Financials (As Reported) 14.2.4. Key Market Focus & Geographical Presence 14.2.5. Recent Developments 14.2.6. Key Management Personnel 15. Strategic Recommendations 16. About Us & Disclaimer 16
RESEARCH RESEARCH METHODOLOGY METHODOLOGY
Research Methodology Market Profiling Data Analysis Data Data Developing List of Respondents Formulating Questionnaire Collection Validation In-depth secondary research was conducted to determine top players in the global saline agriculture market, overall market size and segmental market size. The data was scrutinized using MS-Excel, statistical tools and internal proprietary database to obtain qualitative and quantitative insights about the global saline agriculture market. Data obtained as a result of primary and secondary research was validated through rigorous triangulation. TechSci conducted interviews with industry experts and industry players for data collection and verification. In order to conduct industry experts’ interviews, TechSci formulated a detailed discussion guide. List of industry players and industry specialists was developed. Primary Research Desk Research Company Analysis ✓ ✓ Recent Developments Market Changing Aspects/Dynamics Government Policies Conclusion ✓ ✓ Market Participants Key Strengths ✓ Identifying Key Opinion Leaders Questionnaire Design In-depth Interviews Actionable Insights Data Filter & Analysis Business Solution Research & Intelligence Data Collection ✓ ✓ ✓ ✓ Primary Research Secondary Research Paid Sources LinkedIn TechSci Internal Database Company Websites Company Annual Reports White Paper Study Financial Reports Investor Presentations Regulatory Body Associations, etc. Factiva Hoovers ✓ ✓ ✓ ✓ ✓ ✓ ✓ ✓ ✓ ✓ ✓ 18
Research Methodology Baseline Methodology Our dedicated team of industry experts has monitored and analyzed various aspects of the global saline agriculture market. The team has analyzed the outlook of various segments of this market, while considering the major influencing factors such as increasing global population and the demand to supply food to everyone is further driving the growth of the global saline agriculture market in the upcoming five years.. The study includes market forecasting, which would enable our clients to take better decisions while planning their strategy to achieve sustainability in the global saline agriculture market. Methodology Followed for Calculation of Market Size: Market Size by Value: Market size, in terms of value, for the year 2020 was calculated based on information collected through exhaustive • secondary research and primary surveys, with various key opinion leaders/stakeholders, such as saline agriculture companies, channel partners, market influencers & end users, industry experts, and other industry participants. The team interviewed more than 15 – 20 saline agriculture companies, 100 – 120 end users, and 15 – 20 industry experts and other value • chain stakeholders in the global saline agriculture market to obtain the overall market size from 2016 to 2020, which was validated by the Delphi technique. Taking standard deviation into consideration, the market size was averaged out, to arrive at the market size data during 2016-2020. 19
Research Methodology Respondents were asked about the current and future market growth rates, market shares by water source, by technology, by crop type, by • application, by company and by region. Removing the outlier responses, the geometric mean of growth estimates and provider wise revenue shares generated across various segments were considered, to arrive at the final revenue shares. Revenue shares generated across various segments were further triangulated from other stakeholders. Methodology Followed for Calculation of Market Shares: Market shares by water source, by technology, by crop type, by application, by company and by region were calculated based on the • responses received through primary surveys with industry experts, in which the respondents were asked about the market shares or revenue generated from various segments of saline agriculture markets. The final shares were calculated by taking the geometric mean of the responses gathered from key opinion leaders after eliminating the outliers. Methodology Followed for Forecasting: TechSci Research performed periodical checks on data collected through the surveys with logic checks and analyzed the survey results in • SPSS/Tableau Software. Data triangulation techniques were applied to fill the gaps and to present a more meaningful picture of the market. To forecast global saline • agriculture market, TechSci Research used various forecast techniques such as: Moving Average ✓ Time Series Analysis ✓ Regression Analysis ✓ Econometric and Judgmental Analysis ✓ 20
Research Methodology TechSci Research used its own forecast tool, which is based on the growth of various allied industries in respective regions. TechSci Research also used the impact analysis during short, medium and long- term period to estimate and analyse market demand scenario. It should be noted that the figures compiled are only for the organized market including market share data. Partial List of Companies Interviewed Key Secondary Sources ▪ Seawater Solutions ▪ World Bank ▪ Seawater Greenhouse ▪ TechSci Research Proprietary Database & Knowledge ▪ Agrisea Repository ▪ Seagrass Tech Private Limited ▪ Company Annual Reports ▪ Smart Floating Farms ▪ Industry Magazines ▪ Blubrim Systems ▪ Industry Reports ▪ Red Sea Farms ▪ News Dailies ▪ Salt Farm Texel ▪ Credible Paid Databases 21 © TechSci Research
Industry Brief Advancing agriculture sector is driving the growth of the global saline agriculture market in the forecast period, 2022-2026. According to TechSci Research report, “Saline Agriculture Market - Global Industry Size, Share, Trends, Competition, Opportunity and Forecast, 2016- 2026” The global saline agriculture market is expected to project an impressive growth in the forecast period, 2022-2026, with an impressive CAGR on the account of surging demand for the higher-yielding food crops. The rapidly rising global population is also driving the growth of the global saline agriculture market in the upcoming five years. Due to scarcity of food in the world and increasing demand for food are major reasons responsible for the future growth of the global saline agriculture market in the next five years. Technological advancements and extensive research towards enhancing the quality and quantity of the food crops are also aiding the growth of the global saline agriculture market in the future five years. Continuous increase in the sea level is increasing salinization in the North Sea region. This increases the seepage of seawater; a higher risk of flooding increases the salinization of farmland in the region and thus substantiates the growth of the global saline agriculture market in the forecast years. Saline agriculture also improves and enhances the re-use of degraded farmland and further aids the growth of the global saline agriculture market in the forecast period, until 2026. The global saline agriculture market is segmented on the basis of water source, technology, crop type, application, competitional landscape, and regional distribution. Based on water source, the market is further fragmented into seawater, brackish water, sewage, and others. Seawater is anticipated to register the largest revenue shares of the market and dominate the segment in the upcoming five years on the account of advantages of seawater for the saline agriculture. With increasing sea level and climatic changes, the growth of the market segment is further aiding the growth of the global saline agriculture market in the next five years. Brackish water is also expected to register significant growth in the future five years on the grounds of its application for the saline agriculture. Brackish water can be directly used for the irrigation in the absence of fresh water. Seed irrigation through brackish water is not advised. Rotated interval irrigation with brackish and fresh water can be used with brackish water for salt-tolerant crops or crops at the salt-tolerant growth stages and fresh water for salt sensitive crops or crops at salt sensitive growth Seawater Solutions, Seawater Greenhouse, Agrisea, Seagrass Tech Private Limited, Smart Floastages. On the basis of technology, the market is segmented into saltwater aquaponics, saltwater hydroponics, saltwater greenhouse, and others. Saltwater aquaponics is a combination of plant cultivation and fish rearing. In countries like Japan, saltwater species are much more popular than the freshwater fishes. The saltwater fish species add to the nutrient level of the saline water and supports the agricultural fields, thereby substantiating the growth of the global saline agriculture market in the forecast years. Saltwater hydroponics do not grow the plants in seawater but creates a possibility that the water derived from the sea is somehow utilized in the hydroponic system. In the hydroponic system, sea water is captured, and nutrients are derived out of it, then fresh water is utilized for the irrigation while supplying the derived nutrient from the seawater to replenish the plants growing inside the setup. ting Farms, Blubrim Systems, Red Sea Farms, Salt Farm Texel, are among the major market players in the global platform that lead the market growth of the global saline agriculture market. “Asia Pacific region is expected to dominate the market during forecast years due to high dependency of countries like India, China, and Japan over the agriculture sector to enhance their economic standards. Advancements in the agricultural practices are actively incorporated in these countries and these innovations are supporting the growth of the global saline agriculture market in the upcoming five years. The demand to feed the ever-increasing population of China and India is aiding the demand and the market growth in the future years. Countries like India, Thailand, and Malaysia are surrounded by sea lines. Availability of saline water, and salt soils is also demanding active utilization of saline agriculture to increase the higher yields of the crops. New market players are advised to invest in the extensive research and innovative agriculture practices along with alternate techniques in irrigation of crops, fertilization, and water management such that their brand establishment and consumer demands are well satisfied,” said Mr. Karan Chechi, Research Director with TechSci Research, a research based global management consulting firm. 22
Sample Data - Snapshot Global Saline Agriculture Market Size, By Value (USD Million), 2016-2026F 15.00 14.00 13.00 12.00 11.00 10.00 9.00 8.00 7.00 6.00 5.00 CAGR BY VALUE: XX% 2016 2020 2021E 2026F CAGR BY VALUE: XX% North America Saline Agriculture Market Share, By Water Source, By Value, 2016–2026F Seawater Brackish Water Sewage Others 25% 25% 25% 25% 2026F 25% 25% 25% 25% 2025F 25% 25% 25% 25% 2024F 25% 25% 25% 25% 2023F 25% 25% 25% 25% 2022F 25% 25% 25% 25% 2021E 25% 25% 25% 25% 2020 25% 25% 25% 25% 2019 25% 25% 25% 25% 2018 25% 25% 25% 25% 2017 25% 25% 25% 25% 2016 United States Saline Agriculture Market Share, By Technology, By Value, 2016–2026F Saltwater Aquaponics Saltwater Hydroponics Saltwater Greenhouse Others 25% 25% 25% 25% 2026F 25% 25% 25% 25% 2025F 25% 25% 25% 25% 2024F 25% 25% 25% 25% 2023F 25% 25% 25% 25% 2022F 25% 25% 25% 25% 2021E 25% 25% 25% 25% 2020 25% 25% 25% 25% 2019 25% 25% 25% 25% 2018 25% 25% 25% 25% 2017 25% 25% 25% 25% 2016 23
Report Ordering Report Name: GLOBAL SALINE AGRICULTURE MARKET FORECAST & OPPORTUNITIES 2016 – 2026 License Type Single User License Price $4900 Multi-User License Custom Research License $5900 $8900 To View Sample OR Purchase Report 24
About Us & Disclaimer TechSci Research is a global market research and consulting company with offices in the US, UK and India. TechSci Research provides market research reports in number of areas to organizations. The company uses innovative business models that focus on improving productivity, while ensuring creation of high-quality reports. The proprietary forecasting models use various analyses of both industry-specific and macroeconomic variables on a state-by-state basis to produce a unique ‘bottom-up’ model of a country, regional and global industry prospects. Combined with the detailed analysis of company activity and industry trends, the result is a uniquely rich evaluation of the opportunities available in the market. Related Reports Saudi Arabia Organic Farming Market By Type (Pure Organic Farming v/s Integrated Organic Farming), By Method (Crop Rotation, Polyculture, Mulching, Cutting, Composting, Weed Management, Soil Management, Others), By Land Area (Up to 1 Hectare, 1.1-5 Hectare, 5.1-10 Hectare, 10.1-30 Hectare), By Ownership (Contract Farming v/s Inhouse), By Crop Type (Oilseeds & Pulses, Cereals & Grains, Fruits & Vegetables, Others), By Region, Competition Forecast & Opportunities, 2026 • Saudi Arabia Vertical Farming Market By Structure (Building-Based Vertical Farms v/s Shipping Container Vertical Farms), By Growth Mechanism (Hydroponics, Aeroponics, Aquaponics), By Application (Indoor v/s Outdoor), By Region, Competition Forecast & Opportunities, 2026 • TechSci Research – North America 708 Third Avenue, Manhattan, New York, United States Tel: +1- 646- 360- 1656 Email: sales@techsciresearch.com www.techsciresearch.com TechSci Research – Europe 54, Old brook, Bretton, Peterborough, United Kingdom Email: sales@techsciresearch.com www.techsciresearch.com TechSci Research – Asia-Pacific B – 44, Sector – 57, Noida, National Capital Region, U.P. - India Tel: +91-120-4523900 Email: sales@techsciresearch.com www.techsciresearch.com Disclaimer The contents of this report are based on information generally available to the public from sources believed to be reliable. No representation is made that it is timely, accurate or complete. TechSci Research has taken due care and caution in compilation of data as this has been obtained from various sources including which it considers reliable and firsthand. However, TechSci Research does not guarantee the accuracy, adequacy or completeness of any information and it is not responsible for any errors or omissions or for the results obtained from the use of such information and especially states that it has no financial liability whatsoever to the subscribers / users of this report. The information herein, together with all estimates and forecasts, can change without notice. All the figures provided in this document are indicative of relative market size and are strictly for client’s internal consumption. Usage of the same for purpose other than internal will require prior approval of TechSci Research.