Download
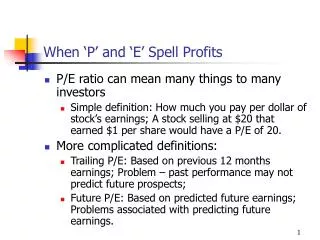
1 / 28
280 likes | 402 Vues
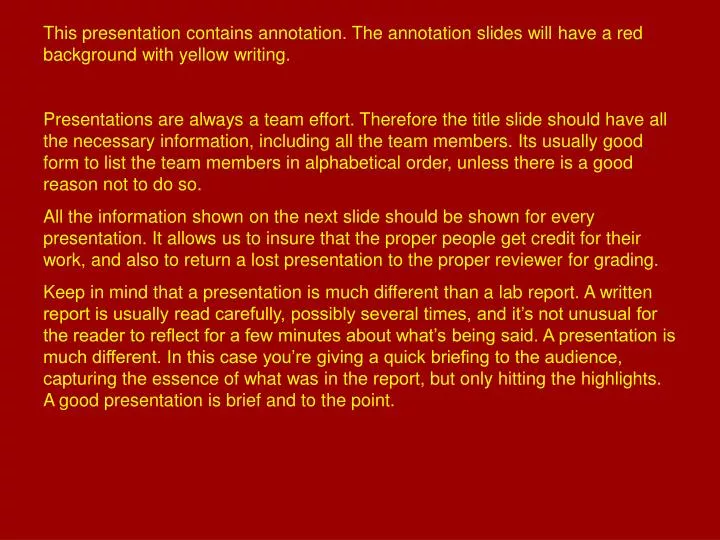
This presentation contains annotation. The annotation slides will have a red background with yellow writing.

E N D
This presentation contains annotation. The annotation slides will have a red background with yellow writing. Presentations are always a team effort. Therefore the title slide should have all the necessary information, including all the team members. Its usually good form to list the team members in alphabetical order, unless there is a good reason not to do so. All the information shown on the next slide should be shown for every presentation. It allows us to insure that the proper people get credit for their work, and also to return a lost presentation to the proper reviewer for grading. Keep in mind that a presentation is much different than a lab report. A written report is usually read carefully, possibly several times, and it’s not unusual for the reader to reflect for a few minutes about what’s being said. A presentation is much different. In this case you’re giving a quick briefing to the audience, capturing the essence of what was in the report, but only hitting the highlights. A good presentation is brief and to the point.
Lab 500: Stock Car Racer EG1003 Section A2 Dates of Experiment: January 15, 2007 through April 1, 2007 Date due: April 6, 2007 Richard Petty and Sarah Fisher
The next slide is common to all lab presentations. It’s basically an agenda showing what you’re going to cover. You can use this slide “as is”. As you get used to the presentation format, however, you can be more imaginative with the categories if you want by using more imaginative names. However, make sure you cover all the material. One note: lab presentations go quickly and are technical briefings. You should not use animations such as slide transitions, things hopping around on the slide, etc. This style is perfectly acceptable for a marketing presentation, and PowerPoint is an extremely effective tool for doing marketing. However, for a technical presentation, especially one with a serious time constraint, avoid any kind of distraction. Note the use of clip art and pictures in this presentation. It adds interest, and keeps the audience’s attention. It should reinforce the presentation and not overwhelm it.
Overview • Experimental Objective • Introduction • Background Information • Materials • Procedure • Data/Observations • Results • Conclusion
The objective should be short and clear. It’s how you define success in the lab. For this lab, success is defined as successfully building and flying the starship faster than the speed of light. Note the throughout the presentation we use short phrases rather than complete sentences. We don’t want to bore the audiences with slides that contain solid text. Also, if you have sentences, you’ll tend to just read the slides, adding to the boredom factor. Most the people in the audience can read as well as you can, so you have no “value added” in doing the presentation. For a competition lab, you should have a bullet that shows an objective of winning the competition. Nobody enters a competition to lose it.
Experimental Objective • Build a stock car racer that can compete in the Daytona 500 and DirecTV 500 • Win the competition against the other Poly teams
The next slide explains why this lab/technology is important. It should emphasize why this technology is good – it’s benefits to humanity or the planet. A good question to ask yourself after you’re done with this slide is “So What?” You should have answered this question of why this stuff is important. If you don’t pass the “So What?” test you’ve done something wrong. Do not confuse this slide with the “Background Information” that comes next. This slide is at a high level. You’ll be able to provide more detail in the rest of the presentation.
Introduction • NASCAR racing has improved safety on consumer cars • Crash-proof passenger compartments • Hoods that crumple instead of shearing off • Rear decks that crumple • Seat belts • NASCAR racing improves car performance (aerodynamics, horsepower)
Background Information typically has several slides. Keep in mind that you only have five minutes for your presentation, so don’t include too much background or you’ll overrun your time budget. Just include what you need to prove your point. A good model to consider is a lawyer making a case at trial. The first thing you have to do is establish your “foundation”, the basic principles that apply here. This might include some history of how this technology was invented or discovered, basic principles that will be used later, formulas you use for calculations in the “Results” section, and terms you use later that are not part of everyday English. A key thing to remember here is relevance. The online manual typically has much more material about the lab that you need to include in your report or presentation. The manual is designed to get you interested in a field, or have more of appreciation for it. Here, we only include what we need.
Background Information • NASCAR racer has two different types of races • Short track races have short laps, tight turns • Need high maneuverability • Super speedway races have long laps, high speeds • Need for aerodynamic efficiency and power
Background Information • Poly EG1003 teams competed in a “real world” environment • Against each other • Against other NASCAR teams • Competed in Daytona 500 (high speed) • Competed in DirecTV 500 (short track)
Background Information • Daytona 500 was held early February • Car had to qualify to be allowed to race • Based on lap times run before the race • DirecTV was held in early April • Enough time to repair damage from Daytona 500 • Car had to qualify again, based on times • Failure to qualify disqualified you from EG1003 competition
Background Information • Competition rules: • Enter Daytona 500 at Daytona International Speedway and record place • Enter DirecTV 500 at Martinsville Speedway and record place
Background Information • Calculate car cost • Best Car Competition Ratio wins:
The “Materials” section of the presentation is a separate section, not part of the procedure. Also, given the brevity of the presentation, the materials should be a “grocery list” rather than items in a sentence. Never use sentences in a presentation unless absolutely necessary! Remember to only show the materials you used, not all the materials that were provided. Some labs allow multiple designs where you won’t use everything.
Materials • 2006 Chevrolet Monte Carlo • 200 feet steel tubing • Dual electronic ignition • 400 pounds fiberglass • Simpson racing seat + 5 point safety belts • 400 HP turbocharged supercharged engine • Fuel cell
Materials (continued) • Small tubing for fuel cell • 40 sets of racing tires • Cargo net for driver window • 3 electrical switches
The Procedure section should only be one or two slides. Again, keep in mind that this is only a five minute presentation, so you don’t have time for much detail. You should review the procedure in the online manual and briefly summarize it. Note that it can be difficult to take a lengthy lab and reduce it down to one or two slides. It’s a skill you will acquire with practice.
Procedure • Review rules, come up with design • Secure sponsorship (Sid’s Hardware) • Obtain car, replace engine, redesign body • Construct passenger cage, install seat and belts • Put body on cage, add hood and trunk • Add spoiler, tires, paint, and decals • Select driver (Richard Petty)
Procedure (continued) • Qualify for Daytona 500, compete, record finishing position • Fix damage • Qualify for DirecTV 500, compete, record finishing position • Calculate cost of car and compute Car Competition Ratio • If winner, fix damage and put in lobby
The “Data/Observations”, like the section in your lab report, only describes what you saw and measured, i.e. raw data. It does not include calculations – the calculations go in the Results section. If you measured things, it should be presented as a table, and possibly a graph as well if it’s important to get an overall view of what happened. If you built something, a sketch or picture of what you built would go here. The overall intent is just to present the facts as they are, and not to interpret them. This allows the audience to keep an open mind, and increases your credibility. Note that sometimes things don’t go right or unexpected things happen. You should include these things in your Data/Observations. They could become critically important later, even though they seemed unimportant at the time. It is not unusual for this section to be several slides, possibly more. The important thing to remember is that you’re giving the audience the facts they need to understand your results and conclusion.
Data/Observations • Car first tested at Floyd Bennett Field • Top speed of 140 MPH estimated • Car taken to Daytona • First test run 160 MPH using speed gun • Car qualified • Speed was 195 MPH, 10th best • Started on outside of 5th row • Car competed, came in 8th • Minor collision hurt aerodynamics
Data/Observations (continued) • Minor damage at Daytona, easily repaired • Car taken to Martinsville, qualified 24th • Started on outside of 12th row • Finished 28th • Poor placement due to intentional accident caused by Tony Steward in #20 car • Considerable time spent repairing damage, costing us time and positions
We’re now heading for the point of the lab. We’ll now apply the principles and formulas in the Background Information to the data and observations shown in the preceding section to give our results. If the lab includes cost as a consideration, you should have one slide showing cost information. This table has the same format as a lab report: five columns showing the item, unit cost, unit of measure (each, set, dozen, etc.), quantity, and total cost for the item, calculated by multiplying the unit cost by the quantity. At last line shows the grand total in the bottom right corner. Note that everything in the Results section has been explained earlier in the presentation. There should not be any new information here other than the application of the stuff you already presented. It’s not unusual for the Results to be one or two slides. For a competition, you should do the calculation for your team alone. You should then show the TA score sheet showing how your team did versus the other team. Be sure to highlight your team’s results. You can do this using a box, an oval, different color font, etc.
Results • Cost of Car:
Results (continued) • Car Competition Ratio Calculation: • Team’s standing in EG1003 competition: • WE FINISHED FIRST!
The Conclusion is, in many ways, your most important slide. It will provide the audience with the impression that they’re most likely to remember about your presentation, so it should be strong. First, you want to show you were successful, or at least partially successful. Emphasize what went right, and note briefly what went wrong. One thing you should do is look at your “Objectives” slide and make sure the Conclusion shows how you met the objective. Be specific. Don’t say “We were successful” or “The lab was a success”. What lab? What were you successful at. For example, in this lab we successfully built the model and flew it down Jay Street faster than the speed of light. No matter how things went, it’s always a good idea to show your commitment to quality by discussing how things could be better. One or two bullets of suggested improvements are always welcome. If you won the competition, be sure to remind the audience. If you didn’t win, try to take credit for something. Look at each term of the equation used to define the winner. Maybe your team had the best value for one of those terms. If you did, take credit for it.
Conclusion • Successfully built and raced a NASCAR racer • We won the EG1003 competition • … and got to put our car in the lobby! • Possible improvements • Make the car more crash proof • Put machine guns under the hood in case Tony Stewart comes back