Download
1 / 28
280 likes | 365 Vues
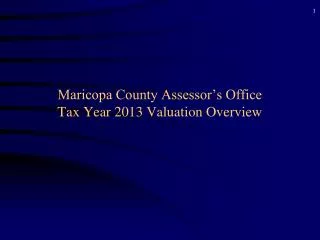
Comprehensive overview of property valuations in Maricopa County for Tax Year 2013, including statistics on vacant land, residential/condo, commercial, and apartments. Details REO sales percentages and valuation methods.

E N D
Maricopa County Assessor’s OfficeTax Year 2013 Valuation Overview
Vacant Land 42% of the 2010 Sales are REO 44% of the 2009 Sales are REO 42% of the 2010 Sales are REO 36% of the 2011 Sales are REO
2010 2011 2009 54,485 46,165 52,866 2008 42,460 2007 10,998
18,941 52,865 42,150
Commercial 9% of the 2009 Sales are REO 9% of the 2009 Sales are REO 20% of the 2010 Sales are REO 36% of the 2011 Sales are REO
Apartments 71% of the 2009 Sales are REO 71% of the 2009 Sales are REO 44% of the 2010 Sales are REO 44% of the 2010 Sales are REO 40% of the 2011 Sales are REO
Apartments 21% of the 2009 Sales are REO 34% of the 2010 Sales are REO 31% of the 2011 Sales are REO
CAMA Model Overview All remaining property types are valued using the Cost Approach
Reminders For 2013 • Commercial Cost Sub Market Adjustment • Based on Commercial Market Area and Use Code • Excludes statutorily assessed shopping centers • Excludes exempt government property (9300-9800’s) • Offices > 10,000 sqft have a separate schedule • Hospitals (Puc 211x, 901x) -35% • Applied to the improvement value only