Download
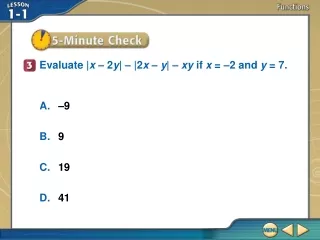
1 / 9
90 likes | 211 Vues
This document explores various mathematical concepts, including rates of change, functions, and graphing techniques. Key areas include the relationship between precipitation rates and water flow, solving linear equations, and matrix operations. The principles of slope, parallel and perpendicular lines, and statistical calculations are also discussed, along with examples and applications in data analysis. By understanding these concepts, readers will enhance their analytical skills and improve their ability to interpret mathematical data in practical scenarios.

E N D
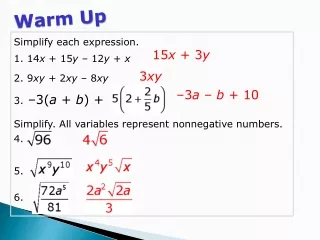
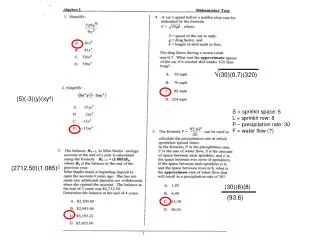
√(30)(0.7)(320) (5)(-3)(y)(xy4) S = sprinklr space: 6 L = sprinklr row: 8 P – precipitation rate: 30 F = water flow (?) (2712.50)(1.085)2 (30)(6)(8) (93.6)
$9 $ 1200(1.063)46 –1200 = 5lb 18lb .063 = 297,450.30 50 ? = (1 – 0.15), means: decrease at 15% 4wk 14wk 3 2 m = 16 4 = 144 x
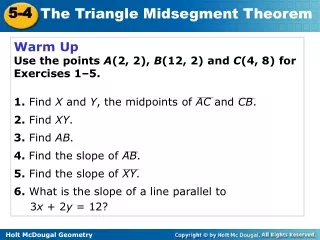
2 5 m = – 1 2 2 5 y + 7 = – (x – 5) m = 2 5 y = – x – 5 Parallel: same slope 2 5 + y = –5 y = typing speed x = # of weeks typing + 21 = typing speed w/ no experience 1 5 m = Perpendicular: opp, reciprocal slope
STAT – EDIT L1 L2 STAT – Calc - #4 ENTER y = value of art x = yearly increase + 3,492 = initial price of the art piece a = -1.0346 decrease 1° y = total cost per visit x = length of visit (hrs) + 40.5 = flat rate price STAT – EDIT L1 L2 STAT – Calc - #4 ENTER a= .0335860516 b= 45.78682467 (18000)( .0335860516) + 45.78682467 = 650.3357535
(y)bds: 9 18 (x)ft: 6 12 Graph it: y = -5x – 1 y = -1/5x – 3 3 2 m = STAT – EDIT L1 L2 STAT – Calc - #4 ENTER a= 1.821428571 b= 28.75 STAT – EDIT L1 L2 STAT – Calc - #4 ENTER a= .5442857143 b= 30.38095238
Work backwards Graph it:
Graph it, for example: y = 2x – 5 y = 2x + 5 48 = 8x + 16 x = 4 y = 11(4) + 16
y = 10x + 60 y = 16x 16x = 10x + 60 x = 10 Matrix: [A]-1[B] 3c + 2a = 120 5c + 1a = 95 {[2] [1]} Matrix: [A]-1[B] {[10] [45]} Matrix: [A]-1[B] {[3.2] [-4]}
= 110,0408.08 Go to the table: x = 7 y = 7.9959 thousands