Golden Ratio Biometric Task
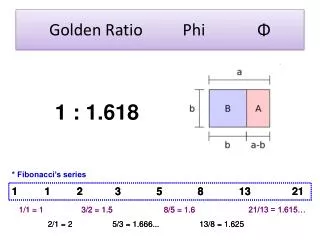
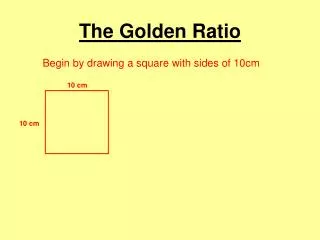
Golden Ratio Biometric Task. Background. Euclid of Alexandria (300 B.C.) defined the golden ratio in his book, “Elements.” . Golden Ratio. ( a + b ) is to a as a is to b. Historically .

Golden Ratio Biometric Task
E N D
Presentation Transcript
Background • Euclid of Alexandria (300 B.C.) defined the golden ratio in his book, “Elements.”
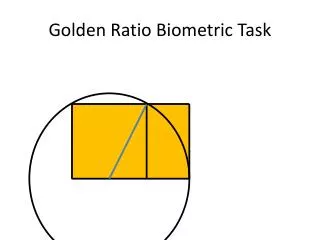
Golden Ratio (a+b) is to a as a is to b.
Historically • Since Euclid, artists and architects who deem this ratio as being the most aesthetically pleasing ratio have used it as a basis for their art and buildings. • The Greeks used the golden ratio in building the Parthenon in Athens.
Mona Lisa • It is thought that Leonardo da Vinci may have used the golden rectangle (having sides that are in the golden ratio) when painting the face of the Mona Lisa.
Sacrament of the Last Supper • The dimensions of Salvador Dali’s painting, “Sacrament of the Last Supper,” are also equal to the Golden Ratio.
What is Beauty? • Some psychologists think that humans who have facial feature ratios closest to the golden ratio are deemed as the most beautiful. • Other psychologists think that the people with the most average measurements in their facial features are considered to be the most beautiful. • Still others believe that people who are not average (have higher cheek bones, thinner jaw, and larger eyes than normal) are deemed as the most beautiful.
What is the task about? • Through the use of statistics, and using our class as a sample, we will investigate the average dimensions of the face and calculate their ratios. • We will measure 13 dimensions and calculate 7 ratios.
Directions Part 1 • Divide into groups of 4 • Name your group • Measure the 13 biometric measurements and record your answer on the table provided. • Use centimeters and round to the nearest tenth. • Use either your face or the photo for all of the measurements. You cannot use the picture for one and then your actual face for the another.
Directions Part 2 • Calculate the seven ratios. Round to the nearest hundredth. • Calculate the mean and standard deviation for the seven ratios of your group. • Each group should provide one completed data sheet to the teacher. • Add your group’s data points to each of the seven dot plots found around the room.