PROCESS SELECTION, DESIGN, AND ANALYSIS
PROCESS SELECTION, DESIGN, AND ANALYSIS. CHAPTER 7. DAVID A. COLLIER AND JAMES R. EVANS. LO1 Describe the four types of processes used to produce goods and services. LO2 Explain the logic and use of the product-process matrix. LO3 Explain the logic and use of the service-positioning matrix.

PROCESS SELECTION, DESIGN, AND ANALYSIS
E N D
Presentation Transcript
PROCESS SELECTION, DESIGN, AND ANALYSIS CHAPTER 7 DAVID A. COLLIER AND JAMES R. EVANS
LO1Describe the four types of processes used to produce goods and services. LO2Explain the logic and use of the product-process matrix. LO3Explain the logic and use of the service-positioning matrix. LO4Describe how to apply process and value stream mapping for process design. LO5Explain how to improve process designs and analyze process maps. LO6Describe how to compute resource utilization and apply Little’s Law.
icalled to make an airline flight reservation just an hour ago. The telephone rang five times before a recorded voice answered. “Thank you for calling ABC Travel Services,” it said. “To ensure the highest level of customer service, this call may be recorded for future analysis.” Next, I was asked to select from one of the following three choices: “If the trip is related to company business, press 1. Personal business, press 2. Group travel, press 3.” I pressed 1. I was then asked to select from the following four choices: “If this is a trip within the United States, press 1. International, press 2. Scheduled training, press 3. Related to a conference, press 4.” Because I was going to Canada, I pressed 2.
Now two minutes into my telephone call, I was instructed to enter my 19-digit customer service number. The voice then said: “Thank you. An operator will be with you shortly.” …Ten minutes passed and then a real person answered the telephone. “Please give me your 19-digit customer service number… I only handle domestic reservations. I’ll transfer you.” A few clicks later a message came on, saying: “All of our international operators are busy. Please hold, as your business is important to us.”
What do youthink? Describe a situation that you have encountered in which a process was either well designed and enhanced your customer experience, or poorly designed and resulted in dissatisfaction.
Process Choice Decisions Process design is an important operational decision that affects the cost of operations, customer service, and sustainability.
Process Choice Decisions – Types of Goods and Services • Custom, or make-to-order, goods and services are generally produced and delivered as one-of-a-kind or in small quantities, and are designed to meet specific customers’ specifications. • Examples include ships, weddings, certain jewelry, estate plans, buildings, and surgery.
Process Choice Decisions – Types of Goods and Services • Option,or assemble-to-order, goods and services are configurations of standard parts, subassemblies, or services that can be selected by customers from a limited set. • Examples are Dell computers, Subway sandwiches, machine tools, and travel agent services.
Process Choice Decisions – Types of Goods and Services • Standard, or make-to-stock, goods and services are made according to a fixed design, and the customer has no options from which to choose. • Examples are appliances, shoes, sporting goods, credit cards, online Web-based courses, and bus service.
Process Choice Decisions – Types of Processes Projects are large-scale, customized initiatives that consist of many smaller tasks and activities that must be coordinated and completed to finish on time and within budget. • Characteristics: One-of-a-kind, large scale, complex, resources brought to site; wide variation in specs and tasks. • Examples: Legal defense preparation, construction, customer jewelry, consulting, and software development.
Process Choice Decisions – Types of Processes Job shop processes are organized around particular types of general-purpose equipment that are flexible and capable of customizing work for individual customers. • Characteristics: Significant setup and/or changeover time, batching, low to moderate volume, many routes, many different products, high work-force skills, and customized to customer’s specs. • Examples: Many small manufacturing companies are set up as job shops, as are hospitals, legal services, and some restaurants.
Process Choice Decisions – Types of Processes Flow shop processes are organized around a fixed sequence of activities and process steps, such as an assembly line, to produce a limited variety of similar goods or services. • Characteristics: Little or no setup time, dedicated to small range of goods or services that are similar, similar sequence of process steps, moderate to high volume. • Examples: Assembly lines that produce automobiles and appliances, production of insurance policies and checking account statements, and hospital laboratory work.
Process Choice Decisions – Types of Processes A continuous flow process creates highly standardized goods or services, usually around the clock in very high volumes. • Characteristics: Very high volumes in a fixed processing sequence, high investment in system, 24-hour/7-day continuous operation, automated, dedicated to a small range of goods or services. • Examples: Chemical, gasoline, paint, toy, steel factories; electronic funds transfer, credit card authorizations, and automated car wash.
Process Choice Decisions A product life cycleis a characterization of product growth, maturity, and decline over time. Four phases: • Introduction • Growth • Maturity • Decline and turnaround • A product’s life cycle has important implications in terms of process design and choice. For example, new products with low sales volume might be produced in a job shop process; however, as sales grow and volumes increase, a flow shop process might be more efficient.
The Product-Process Matrix The product-process matrixis a model that describes the alignment of process choice with the characteristics of the manufactured good. • The most appropriate match between type of product and type of process occurs along the diagonal in the product-process matrix. • As one moves down the diagonal, the emphasis on both product and process structure shifts from low volume and high flexibility, to higher volumes and more standardization.
Exhibit 7.1 Characteristics of Different Process Types
Exhibit 7.2 Product-Process Matrix
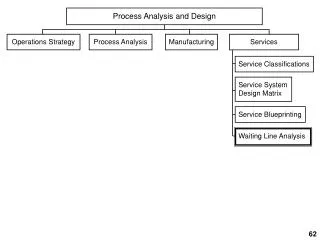
The Service-Positioning Matrix In the product-process matrix, product volume, the number of products, and the degree of standardization/customization determine the manufacturing process that should be used. This relationship between volume and process is not found in many service businesses. The Service-Positioning Matrix is similar to the product-process matrix in that it suggests that the nature of the customer’s desired service encounter activity sequence should lead to the most appropriate service system design and that superior performance results by generally staying along the diagonal of the matrix.
The Service-Positioning Matrix A pathway is a unique route through a service system. Pathways can be customer- or provider-driven, depending on the level of control that the service firm wants to ensure. The service encounter activity sequence consists of all the process steps and associated service encounters necessary to complete a service transaction and fulfill customer’s wants and needs.
The Service-Positioning Matrix Customer-routed services are those that offer customers broad freedom to select the pathways that are best suited for their immediate needs and wants, from many possible pathways through the service delivery system. • Examples include searching the Internet, museums, health clubs, and amusement parks.
The Service-Positioning Matrix Provider-routed services constrain customers to follow a very small number of possible and predefined pathways through the service system. • Examples are a newspaper dispenser and logging on to a secure online bank account.
Exhibit 7.3 The Service Positioning Matrix Source: Adapted from D. A. Collier and S. M. Meyer, “A Service Positioning Matrix,”International Journal of Production and Operations Management, 18, no. 12, 1998, pp. 1123–1244. Also see D. A. Collier and S. Meyer, “An Empirical Comparison of Service Matrices,”International Journal of Operations and Production Management, 2000 (no. 5–6), pp. 705–729.
Process Design – Four Levels of Work Task—a specific unit of work required to create an output. Activity—a group of tasks (sometimes called a workstation) needed to create and deliver an intermediate or final output. Process—a group of activities. Value chain—a network of processes.
“We divided the work; but stood together.” - Mr. John Ringling, Ringling Bros., Bamum & Bailey Circus, 1907
Exhibit 7.4 The Hierarchy of Work and Cascading Flowcharts for Antacid Tablets
Process and Value Stream Mapping A process map (flowchart) describes the sequence of all process activities and tasks necessary to create and deliver a desired output or outcome. • Process maps document how work either is, or should be, accomplished, and how the transformation process creates value. • A process boundary is the beginning or end of a process. • Makes it easier to obtain management support, assign process ownership, and identify where performance measures should be taken.
Process and Value Stream Mapping In service applications, flowcharts generally highlight the points of contact with the customer and are often called service blueprints or service maps. Such flowcharts often show the separation between the back office and the front office with a “line of customer visibility.”
Exhibit 7.5 Automobile Repair Flowchart
Process and Value Stream Mapping The value stream refers to all value-added activities involved in designing, producing, and delivering goods and services to customers. A value stream map (VSM) shows the process flows in a manner similar to an ordinary process map; however, the difference lies in that value stream maps highlight value-added versus non-value-added activities and include costs associated with work activities for both value- and non-value-added activities.
Process and Value Stream Mapping • Examples of non-value-added activities include: • Transferring materials between two nonadjacent workstations • Overproducing • Waiting for service or work to do • Not doing work correctly the first time • Requiring multiple approvals for a low cost electronic transaction
Exhibit 7.6 Restaurant Order Posting and Fulfillment Process
Exhibit 7.7 Value Stream Map for Restaurant Order Posting and Fulfillment Process
Process Design Methodology • Define the purpose and objectives of the process. • Create a detailed process or value stream map that describes how the process is currently performed. • Evaluate alternative process designs. • Identify and define appropriate performance measures for the process. • Select the appropriate equipment and technology. • Develop an implementation plan to introduce the new or revised process design.
Process Mapping Improves Pharmacy Service Metro Health Hospital in Grand Rapids, Michigan, applied process mapping reducing the lead time for getting the first dose of a medication to a patient in its pharmacy services operations. The lead time was measured from the time an order arrived at the pharmacy to its delivery on the appropriate hospital floor. A process improvement team carefully laid out all the process steps involved and found that it had a 14-stage process with some unnecessary steps, resulting in a total lead time of 166 minutes. (continued)
Process Mapping Improves Pharmacy Service During the evaluation process, the pharmacy calculated that technicians were spending 77.4 percent of their time locating products; when a pharmacist needed a technician for clinical activities, the technician was usually off searching for a drug. Overall, the pharmacy at Metro realized a 33-percent reduction in time to get medications to patients, and reduced the number of process steps from 14 to nine simply by removing non-value-added steps. Patients have experienced a 40-percent reduction in pharmacy-related medication errors, and the severity of those errors has decreased.
Process Analysis and Improvement • Strategies: • Increasing revenue by improving process efficiency in creating goods and services and delivery of the customer benefit package. • Increasing agility by improving flexibility and response to changes in demand and customer expectations. • Increasing product and/or service quality by reducing defects, mistakes, failures, or service upsets. • Decreasing costs through better technology or elimination of non-value-added activities. • Decreasing process flow time by reducing waiting time or speeding up movement through the process and value chain. • Decreasing the carbon footprint of the task, activity, process and/or value chain.
Process Analysis and Improvement • Questions to ask for process analysis: • Are the steps in the process arranged in logical sequence? • Do all steps add value? Can some steps be eliminated and should others be added in order to improve quality or operational performance? Can some be combined? Should some be reordered? • Are capacities of each step in balance; that is, do bottlenecks exist for which customers will incur excessive waiting time? • What skills, equipment, and tools are required at each step of the process? Should some steps be automated?
Process Analysis and Improvement At which points in the system (sometimes called process fail points) might errors occur that would result in customer dissatisfaction, and how might these errors be corrected? At which point or points in the process should performance be measured? What are appropriate measures? Where interaction with the customer occurs, what procedures, behaviors, and guidelines should employees follow that will present a positive image? What is the impact of the process on sustainability? Can we quantify the carbon footprint of the current process?
Process Analysis and Improvement Reengineering has been defined as “the fundamental rethinking and radical redesign of business processes to achieve dramatic improvements in critical, contemporary measures of performance, such as cost, quality, service, and speed.”
Process Design and Resource Utilization Utilization is the fraction of time a workstation or individual is busy over the long run. Utilization (U) = Resources Used [7.1]Resources Available or Utilization (U) = Demand Rate [7.2] [Service Rate × Number of Servers]
Exhibit 7.6 Restaurant Order Posting and Fulfillment Process
Exhibit 7.8 Utilization Analysis of Restaurant Order Posting and Fulfillment Process
Exhibit 7.9 Revised Utilization Analysis of Restaurant Order Posting and Fulfillment Process (4 chefs)
Exhibit 7.10 Revised Utilization Analysis of Restaurant Order Posting and Fulfillment Process (4 ovens)
Solved Problem An inspection station for assembling printers receives 40 printers/hour and has two inspectors, each of whom can inspect 30 printers per hour. What is the utilization of the inspectors? What service rate would be required to have a target utilization of 85 percent? Solution The labor utilization at this inspection station is calculated to be 40/(2 × 30) = 67%. If the utilization rate is 85%, we can calculate the target service rate by solving the equation: 85% = 40/(2 × SR) 1.7 × SR = 40 SR = 23.5 printers/hour
Process Design and Resource Utilization The average number of entities completed per unit time— the output rate—from a process is called throughput. • Throughput might be measured as parts per day, transactions per minute, or customers per hour, depending on the context. • A bottleneck is the work activity that effectively limits throughput of the entire process. • Identifying and breaking process bottlenecks is an important part of process design and improvement, and will increase the speed of the process, reduce waiting and work-in-process inventory, and use resources more efficiently.
Little’s Law Flow time, or cycle time, is the average time it takes to complete one cycle of a process. Little’s Law is a simple formula that explains the relationship among flow time (T ), throughput (R ), and work-in-process (WIP ). Work-In-Process = Throughput × Flow Time or WIP = R × T [7.3] • If we know any two of the three variables, we can compute the third.