
Uploaded by
madison-harrington
11 SLIDES
203 VUES
110LIKES
Interactive Data Visualization Tool with Advanced Control Features
DESCRIPTION
Enhance your data analysis experience with custom-designed controls using HTML5, CSS3, and jQuery. This tool allows you to sort, view, and access data quickly with interactive controls and visualization enhancements. Utilize FusionCharts to create dynamic scatter data canvases.
Download
1 / 11
Télécharger la présentation 
Interactive Data Visualization Tool with Advanced Control Features
An Image/Link below is provided (as is) to download presentation
Download Policy: Content on the Website is provided to you AS IS for your information and personal use and may not be sold / licensed / shared on other websites without getting consent from its author.
Content is provided to you AS IS for your information and personal use only.
Download presentation by click this link.
While downloading, if for some reason you are not able to download a presentation, the publisher may have deleted the file from their server.
During download, if you can't get a presentation, the file might be deleted by the publisher.
E N D
Presentation Transcript
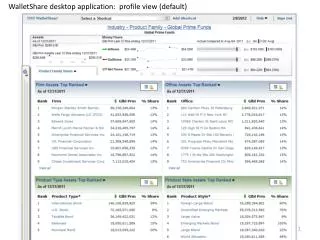
WalletShare : visualization enhancement - HTML5, CSS3 and jQueryfor touch controls
Custom JavaScript for the scatter data canvas using jQuery & FusionCharts


More Related