Exploring the World through Leaves and Boxes
220 likes | 385 Vues
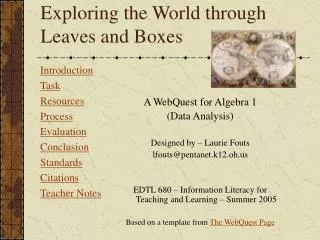
Introduction Task Resources Process Evaluation Conclusion Standards Citations Teacher Notes. A WebQuest for Algebra 1 (Data Analysis) Designed by – Laurie Fouts lfouts@pentanet.k12.oh.us EDTL 680 – Information Literacy for Teaching and Learning – Summer 2005

Exploring the World through Leaves and Boxes
E N D
Presentation Transcript
Introduction Task Resources Process Evaluation Conclusion Standards Citations Teacher Notes A WebQuest for Algebra 1 (Data Analysis) Designed by – Laurie Fouts lfouts@pentanet.k12.oh.us EDTL 680 – Information Literacy for Teaching and Learning – Summer 2005 Based on a template from The WebQuest Page Exploring the World through Leaves and Boxes
Introduction • There is so much information available through the use of the Internet. You are going to use a small part of this information to investigate statistics available about the countries of the world and see how to make sense of the information you gather.
Task • Your group will be investigating four different statistics from 10 countries around the world in order to compare and analyze them. You will investigate how Stem-and-Leaf Plots and Box-and-Whiskers Plots can be used to effectively communicate this information to others. You will then construct these plots to present the information you find. • You will be working in groups of three that will be assigned by the instructor. Within each group you will select a Researcher, a World Explorer, and a Statistician. • This WebQuest is required to be completed within a week. Follow the dates on the timeline given to you by your teacher.
Resources • Computer (with printer) and access to the Internet • Graphing Calculator • Paper • Pencil • Ruler • http://davidmlane.com/hyperstat/intro.html • http://discoverer.sirs.com/ • http://mathforum.org/library/drmath/drmath.high.html • http://school.eb.com/eb • http://world.eb.com/ • http://www.ifigure.com/math/stat/descript.htm • http://www.infohio.org/
Process • You will be assigned to a group of three to complete this WebQuest • Select one person to be the Researcher. His/her task will be to investigate the mathematical terms and definitions for the group. • Select one person to be the World Explorer. His/her task will be to find the needed statistics for each of the assigned countries and to find a map showing these countries. • Select one person to be the Statistician. His/her task will be to create the required graphs for the country statistics. • As a group you must submit a Summary of your findings.
Researcher • Your task is to use electronic resources to find mathematical definitions (and possibly examples) that the other member of your group will need to complete their assignments. • Record the results of your searches on the Researcher’s Findings page and share this information with your group members. • Begin with the Researcher Learning Activity • For more information try these Statistical Resources. (See Chapter 1 “About Descriptive Statistics”) • Ask Dr. Math is another excellent resource.
Researcher Learning Activity To get you started, begin with INFOhio. 1. Select “Resources for Grades 9-12” 2. Select Britannica Online School Edition 3. Enter local username and password if prompted for authentication. Your teacher, librarian, or technology coordinator will have this information. 4. Select Britannica Online School Edition once again. 5. Under “Learning Materials” select Mathematics. 6. Under Statistics click on Study Guides. 7. Select “Statistics: Deviation from the Mean” 8. Under “Content List” select topics.
Researcher’s Findings Researcher:_______________________ Group Name: ___________________________ • Directions: Print out this page and answer each of the following questions. Share your results with the members of your • group and turn a copy in to the instructor. • Define mean, median, and mode. • Calculate the mean, median, and mode for the following numbers: 15, 9, 13, 24, 16, 9, 22, 18, 31 • Show an ordered Stem-and-Leaf plot for the data listed in Problem #2 above. • What is the definition of inter-quartile range? • What information is shown in a Box and Whiskers Plot? • Draw and label a Box and Whiskers Plot for the data in Problem #2 above.
World Explorer • Your task is to gather the data about the 10 countries to be used by your group. • For each of the following countries, gather the data for male and female life expectancy. Use the countries of Australia, Brazil, China, Cuba, Egypt, India, Iraq, Russia, South Africa, and the United States. • For the same 10 countries, gather the data for male and female percent literacy. • You will find this information on World Data Analyst. For directions, click here. • Record this information on the World Explorer’s Findings page and share this information with your group members. • Find a world map on the Internet and print this map. Locate these ten countries on this map. SIRS Discoverer on INFOhio is a good source to use for these maps. Remember, any passwords needed can be obtained from your instructor or librarian.
World Data Analyst To get started, begin with INFOhio. 1. Select “Resources for Grades 9-12” 2. Select “World Data Analyst” 3. Enter local username and password if prompted for authentication. Your teacher, librarian, or technology coordinator will have this information. 4. Select “World Data Analyst” once again. 5. Under “Country Comparison” select “Current Comparison” 6. Select the countries and statistics required following on-screen directions and create table.
World Explorer’s Findings World Explorer:_______________________ Group Name: ___________________________ • Directions: Print out this page and record the necessary information. Share this information with your group and turn • in a copy to the instructor.
Statistician • Your task is to take the data found by your World Explorer and use it to create Stem-and-Leaf Plots and Box-and-Whiskers Plots to illustrate this data. • Record your graphs on the Statistician’s Findings page. • For help with calculations of mean, median, and mode consult the calculators at iFigure • If you need more help with the plots, check these resources: Statistical Resources (See Chapter 1 “About Descriptive Statistics”) Ask Dr. Math
Statistician’s Findings Statistician:_______________________ Group Name: ___________________________ • Directions: Print out this page with the following page and draw and label the required plots. Share the information with the • other members of your group and turn in a copy to the instructor.
Statistician’s Findings, Page 2 Statistician:_______________________ Group Name: ___________________________ • Directions: Print out this page with the preceding page and draw and label the required plots.
Group Summary Page Group Name: _______________________ Group Members: __________________________ __________________________ __________________________ • Directions: This page is to be completed by the group as a whole. Print out this page, answer each question completely, and turn in a copy to the instructor. • What are the advantages to using a Stem-and-Leaf Plot? How did it help you analyze your data? • Using the Box-and-Whisker Plots for Male and Female Life Expectancy, what conclusions can you draw? • Using the Box-and-Whisker Plots for Male and Female Literacy, what conclusions can you draw? • How did the format of a Box-and-Whisker Plot help you to arrive at your conclusions?
Evaluation The following rubric will be used to evaluate this Webquest. A maximum of 60 points are available on this assignment.
Conclusion • Congratulations on completing this WebQuest! As a result you should now better understand Stem-and-Leaf Plots and also Box-and-Whisker Plots. You should also have learned more about resources available to you on the Internet.
Standards • Ohio K – 12 Content Standards for Mathematics Standard: Data Analysis and Probability Benchmark: (08-10) A. Create, interpret and use graphical displays and statistical measures to describe data; e.g. box-and-whisker plots, histograms, scatterplots, measures of center and variability. Grade Level Indicator: 1. Use, create and interpret scatterplots and other types of graphs as appropriate. Grade Level Indicator: 2. Represent and analyze bivariate data using appropriate graphical displays (scatterplots, parallel box-and-whisker plots, histograms with more than one set of data, tables, charts, spreadsheets) with and without technology. • Ohio K – 12 Content Standards for Mathematics Standard: Data Analysis and Probability Benchmark: (08-10) D. Find, use and interpret measures of center and spread, such as mean and quartiles, and use those measures to compare and draw conclusions about sets of data. Grade Level Indicator: 4. Compare two sets of data using measures of center (mean, mode, median) and measures of spread (range, quartiles, interquartile range, percentiles). (continued) Next Page>
Standards – Page 2 • Ohio Academic Content Standards for Technology Standard: Technology and Information Literacy Benchmark: (06-08) B. Use technology to conduct research and follow a research process mode which includes the following: develop essential question; identify resources; select, use and analyze information: synthesize and generate a product; and evaluate both process and product. Grade Level Indicator: 2. Identify and evaluate relevant information and select pertinent information found in each source. Grade Level Indicator: 3. Analyze information, finding connections that lead to a final information product. • Ohio Academic Content Standards for Technology Standard: Technology and Information Literacy Benchmark: (06-08) D. Select, access, and use appropriate electronic resources for a defined information need. Grade Level Indicator: 2. Retrieve information in different types of subscription (fee-based) databases to support information for a curricular need. (continued) Next Page>
Standards – Page 3 • Guidelines for Effective School Library Media Programs in Ohio Standard: Information Literacy Benchmark: (06-08) D. Evaluate the accuracy, authority, objectivity, currency, coverage and relevance of information and data sources. Grade Level Indicator:Compare multiple sources (online encyclopedia, Web site, online magazine database, print source) to check accuracy of information. Do facts match on each site? • Guidelines for Effective School Library Media Programs in Ohio Standard: Information Literacy Benchmark: (06-08) E. Conduct research and follow a research process model that includes the following: develop essential question; identify resources; select, use and analyze information; synthesize and generate a product; and evaluate both process and product. Grade Level Indicator: 3. Select information from different types of subscription resources (fee-based, pay-to-use) to meet an information need (e.g., magazine database, picture archive, online encyclopedia). Grade Level Indicator: 5. Understand how to access electronic resources at school and from home. Grade Level Indicator: 10. Communicate findings orally, visually or in writing and draw conclusions about findings.
Teacher Notes • It would be helpful if students are exposed to the concepts of mean, median, mode, and range prior to this activity. • Graphing calculators may be used to construct the plots. • Since the INFOhio website is used frequently, it would be helpful to instruct students on its use prior to this activity.
Citations Box and whisker plots. (2000, February 13). Retrieved July 19, 2005, from Math Forum @ Drexel Web site: http://mathforum.org/library/drmath/view/52188.html Country comparisons. (n.d.) Retrieved July 20, 2005, from World Data Analyst: http://world.eb.com/ Descriptive statistics. (n.d.) Retrieved July 21, 2005, from HyperStat Online: http://davidmlane.com/hyperstat/intro.html Descriptive statistics. (n.d.) Retrieved July 19, 2005, from iFigure Web site: http://www.ifigure.com/math/stat/descript.htm Maps. (n.d.) Retrieved August 1, 2005, from SIRS Discoverer: http://discoverer.sirs.com/ Statistics: An introduction. (n.d.) Retrieved July 14, 2005, from Britannica Online School Edition: http://school.eb.com/eb/browse/learning?topic=g612_math_studyguides_statistics Statistics: Deviation from the mean. (n.d.) Retrieved July 14, 2005, from Britannica Online School Edition: http://school.eb.com/eb/browse/learning?topic=g612_math_studyguides_statistics Stem and leaf and scatter plots. (1998, October 13). Retrieved July 19, 2005, from Math Forum @ Drexel Web site: http://mathforum.org/library/drmath/view/52770.html