Download
1 / 27
270 likes | 456 Vues
第五章 三維空間繪圖. 5.1 基本三維繪圖. 對於函數而言,每給一組 f ( x , y ) ,便能求得其相對應的高度 z ,如下圖所示:. 5.1.1 繪製三維的網格圖. 利用 mesh 函數可繪製三維的網格圖:. >> xx=[2 3 4;2 3 4;2 3 4;2 3 4]; >> yy=[0 0 0;1 1 1;2 2 2;3 3 3] >> zz=[7 7 6;7 7 7;8 8 9;8 8 9] >> mesh(xx,yy,zz). Matlab 提供了 meshgrid 函數,可以建立 xx 與 yy 矩陣:.

E N D
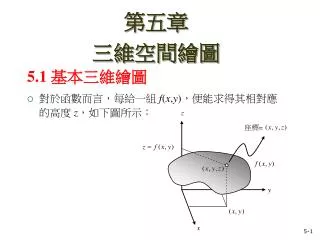
第五章 三維空間繪圖 5.1 基本三維繪圖 • 對於函數而言,每給一組 f(x,y),便能求得其相對應的高度 z,如下圖所示:
5.1.1 繪製三維的網格圖 • 利用mesh函數可繪製三維的網格圖:
>> xx=[2 3 4;2 3 4;2 3 4;2 3 4]; >> yy=[0 0 0;1 1 1;2 2 2;3 3 3] >> zz=[7 7 6;7 7 7;8 8 9;8 8 9] >> mesh(xx,yy,zz)
Matlab提供了meshgrid函數,可以建立xx與yy矩陣: >> x=linspace(-2,2,30); >> y=linspace(-2,2,30); >> [xx,yy]=meshgrid(x,y); >> zz=xx.*exp(-xx.^2-yy.^2); >> mesh(xx,yy,zz)
下面是meshc函數與waterfall函數用法: >> meshc(xx,yy,zz) >> waterfall(xx,yy,zz)
5.1.2 繪製三維的曲面圖 • 想要對網格面上色,可利用surf或其它相關的函數: >> surf(xx,yy,zz); >> surfc(xx,yy,zz);axis tight;
5.2 簡易的三維繪圖函數 • ezmesh與ezsurf函數可以快速的繪出三維的圖形:
>> ezmesh('exp(-0.2*x)*cos(t)') >> ezsurfc('y/(x^2+y^2+1)',36)
5.3 內建的三維圖形展示函數—peaks • peaks所描述的數學函數,其定義式為
>> peaks(24); >> [xx,yy,zz]=peaks(32); >> surfc(xx,yy,zz);
5.4 空間曲線繪圖 • plot3函數可用來繪製空間的曲線: >> plot3(t.*sin(t),t.*cos(t),t);
5.5 等高線繪圖5.5.1 二維的等高線圖 • Matlab的contour函數可用來繪製二維的等高線圖:
要標註等高線的值: 把繪出的等高線圖設給某一個變數 把這個變數傳遞給clabel函數
>> clabel(cmat) >> cmat=contour(xx,yy,zz);
5.5.2 三維的等高線圖 • contour3函數可繪製三維的等高線圖: >> zz=peaks; >> contour3(zz);
5.6 編修三維繪圖5.6.1 三維圖形的基本編修 • 下表列出了三維圖形常用的編修指令:
>> hidden off; >> box on;
仰角 方位角 5.6.2 改變三維圖形的視角 • 如果想更改圖形的觀測角度,可用利用view函數: 觀測點=view(方位角,仰角)
按下Rotate 3D按鈕 1 • 按下工具列上的Rotate 3D鈕 ,可利用滑鼠旋轉所繪製的圖形 2 利用滑鼠拖曳來旋轉圖形
5.6.3 修改三維圖形的曲面顏色 • Matlab是利用color map,依所繪製之函數值的大小來對曲面上色。
colormap可限定三維的圖形使用特定的顏色對應表colormap可限定三維的圖形使用特定的顏色對應表 • 下表列出了colormap與colorbar函數的用法:
>> colormap(hot(32));colorbar; >> colormap('default');colorbar;