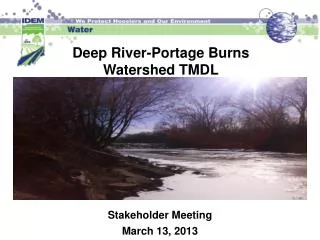
Portage Creek Watershed Hydrologic Study
470 likes | 585 Vues
This hydrologic study of the Portage Creek Watershed conducted by Dave Fongers aims to assess and characterize water distribution, stream morphology, and hydrologic changes that affect channel stability. Key objectives include evaluating the impacts of hydrologic changes on stream flow, providing stormwater management recommendations, and identifying critical areas for intervention. The analysis emphasizes morphologic stability and highlights the relationship between land cover, imperviousness, and stream health. This foundational study supports effective watershed management strategies for maintaining water quality and flood control.

Portage Creek Watershed Hydrologic Study
E N D
Presentation Transcript
Portage Creek Watershed Hydrologic Study Dave Fongers 517-373-0210 fongersd@michigan.gov
Stream Morphology is the form and structure of a stream (cross-section, sinuosity, profile).
Morphologic Stabilitymeans no netchange in channel shape, which occurs only if channel-forming flowsare stable. “A river is the report card for its watershed.” Alan Levere, CT DEP
Morphologic Stabilitymeans no netchange in channel shape, which occurs only if channel-forming flowsare stable. Extreme flood flows generally have little effect on channel morphology because they are so rare. More frequent flows, those that recur about every1 to 2 years, are generally the dominant channel-forming flows in stable, natural streams (Schueler, 1987 and Rosgen, 1996).
Hydrologic changes can cause a stream to be morphologically unstable for 60 years or more.
Physical indicator of unstable stream morphology: extensive, excessive erosion, especially along straight reaches
Goals of Hydrologic Analysis for NPS Watershed Management Plans • Characterize the watershed • Understand stream flow impacts of hydrologic changes • Provide a basis for stormwater management recommendations • Help determine critical areas
M-52 Williamsville to Ellsworth Lakes Kane Road McConachie Lake Tiplady Road Little Portage Lake Toma Road Halfmoon to Woodburn Lakes Unadilla Road Hi-Land Lake
Stream Order Stream order provides an indication of stream size and potential power. 1st to 3rd order streams may be more sensitive to hydrologic changes. Data courtesy of MDNR Institute for Fisheries Research and the USGS Great Lakes Gap
Conservation and Recreation Lands 25% of watershed
Percent Imperviousness Every Portage Creek subbasin is less than 5% impervious. * The expected quality of streams in this range of impervious cover is generally influenced more by other watershed characteristics such as forest cover, road density, riparian continuity, and cropping practices. Excerpted from “The Practice of Watershed Protection” by Thomas Schueler and Heather Holland, p. 15
1800 Land Cover 1978 2000
1800 Soils 1978 2000
Goals of Hydrologic Analysis forNPS Watershed Management Plans • Characterize the watershed • Understand stream flow impacts of hydrologic changes • Provide a basis for stormwater management recommendations • Help determine critical areas
Subbasins Subbasins Non-contributing
Runoff Volume per Area 1800 Land Cover • Runoff from each subbasin for a standard storm is calculated to highlight subbasins that generate a higher proportion of runoff due to soils and land cover. 2000 Land Cover 1978 Land Cover
Runoff Volume Change per Area Change: 1800 to 2005
1978 Land Cover Flood Flow Yields • Yields are calculated as a measure of hydrologic responsiveness. cfs/acre 2000 Land Cover 1800 Land Cover
Yields: Peak Flow per Area 1800 to 1978 1978 to 2000
Example of land use change and its effect
70% increase in peak flow, 170% increase in runoff volume, former instantaneous peak flow now lasts ~4 hours Pre-development Post-development 50 percent chance (2-year) flow
Flashiness Analysis A stream described as flashy responds to rainfall by rising and falling quickly. A stream that is not flashy would rise and fall less for an equivalent rainfall and would typically derive more of its overall flow from groundwater.
David Baker, Peter Richards, Timothy Loftus, and Jack Kramer (2004) proposed quantifying flashiness by measuring the path length of flow oscillations for data from gaged streams. Longer paths correlate with flashier streams, while more constant flows have shorter path lengths. 0.56 0.05 Watershed areas and total yearly flow volumes are similar.
Saline River near Saline Note: Flows are adjusted to an equivalent drainage area of 79 square miles. Mill Creek near Lima Center Mill Creek near Dexter River Raisin near Manchester Portage Creek at Tiplady
Portage gage compared to 38 statewide gages with similar sized watersheds (80 to 100 sq. mi.). The Portage gage is third lowest, sorted by 2-year peak flow or by 2-year peak flow divided by drainage area. Saline River near Saline Mill Creek near Lima Center Mill Creek near Dexter River Raisin near Manchester Portage Creek at Tiplady
Goals of Hydrologic Analysis forNPS Watershed Management Plans • Characterize the watershed • Understand stream flow impacts of hydrologic changes • Provide a basis for stormwater management recommendations • Help determine critical areas
Water quality, preventing stream channel erosion, and flood control are concerns of watershed planners and stakeholders. The rain events that produce these concerns overlap. In general, small storms, and runoff from the early part of larger storms, are the focus of water quality BMPs. Channel protection measures focus on larger, but still fairly common storm flows. Flood control is generally associated with infrequent events. adapted from Sullivan, 2002
Precipitation Water Quality (First Flush) Interception, Evapotranspiration, Infiltration Channel Shape (Morphology) Flooding
First Flush Treatment Small storms and the first part of the runoff from larger storms typically carry most of the pollutants to an urban stream.
From Gun River Hydrologic and Hydraulic Study, Appendix 6 Extended Detention
Low Impact Development (LID) • LID integrates stormwater practices throughout the site, preserves natural functions, and reduces impervious surfaces • Bioretention/rain garden • Grassed swale • Green roofs • Porous pavement • Stormwater reuse • Preservation of natural features • Native plantings Porous Pavement East Hills Center Green Roof Bazzani Associates Pokagon Edewat subdivision
Goals of Hydrologic Analysis forNPS Watershed Management Plans • Characterize the watershed • Understand stream flow impacts of hydrologic changes • Provide a basis for stormwater management recommendations • Help determine critical areas