Regression with 2 IVs
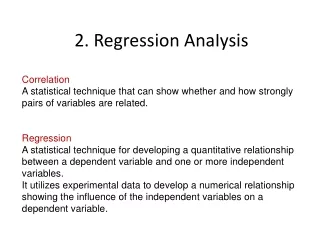
Regression with 2 IVs. Generalization of Regression from 1 to 2 Independent Variables. Write a raw score regression equation with 2 IVs in it. What is the difference in interpretation of b weights in simple regression vs. multiple regression?.

Regression with 2 IVs
E N D
Presentation Transcript
Regression with 2 IVs Generalization of Regression from 1 to 2 Independent Variables
Write a raw score regression equation with 2 IVs in it. What is the difference in interpretation of b weights in simple regression vs. multiple regression? What happens to b weights if we add new variables to the regression equation that are highly correlated with ones already in the equation? Why do we report beta weights (standardized b weights)? Questions
Write a regression equation with beta weights in it. How is it possible to have a significant r-square and non-significant b weights? What are the three factors that influence the standard error of the b weight? Describe R-square in two different ways, that is, using two distinct formulas. Explain the formulas. More Questions
Equations 1 IV. Define terms. Multiple IVs. One score, 1 intercept; 1 error; many slopes. Predicted value. Recall slope and intercept for 1 IV: Sum of cross-products.
Equations (2) Note: b weights use SSx1, SSx2, and all 3 cross products. Unlike slopes, the intercept is a simple extension of the 1 IV case.
Job Perf 3 Mech Apt 58 Consc 38 174 114 2204 Y X1 X2 X1*Y X2*Y X1*X2 Y X1 X2 X1*Y X2*Y X1*X2 65 1038 655 3513 2219 34510 Sum 1 40 25 40 25 1000 20 20 20 20 20 20 N 2 45 20 90 40 900 3.25 51.9 32.75 175.65 110.95 1725.5 M 1 38 30 38 30 1140 1.25 7.58 5.24 84.33 54.73 474.60 SD 29.75 1091.8 521.75 USS Numerical Example Chevy mechanics; mechanical aptitude & conscientiousness. Find sums. Note. Only some of the data are shown. Size problem in Powerpoint.
SSCP Matrix SSCP means sums of squares and cross-products.
Find Estimates SSCP Predicted job performance as a function of test scores.
Scatterplot 3 Predicted Y is a plane.
Y X1 X2 Y' Resid 2 45 20 1.54 0.46 1 38 30 1.81 -0.81 3 50 30 2.84 0.16 2 48 28 2.50 -0.50 3 55 30 3.28 -0.28 3 53 34 3.45 -0.45 4 55 36 3.80 0.20 4 58 32 3.71 0.29 3 40 34 2.33 0.67 5 55 38 3.98 1.02 3 48 28 2.50 0.50 3 45 30 2.41 0.59 2 55 36 3.80 -1.80 4 60 34 4.06 -0.06 5 60 38 4.41 0.59 5 60 42 4.76 0.24 5 65 38 4.84 0.16 4 50 34 3.19 0.80 3 58 38 4.24 -1.24 M = 3.25 51.9 32.75 3.25 0 V = 1.57 57.46 27.46 1.05 0.52 USS=29.83 19.95 9.42 R2 Y is linear function of Xs plus error. Use capital R for multiple regression. R2 is the proportion of variance in Y due to regression. Note: N=19; lost 1.
Excel Example Grab from the web under Lecture, Excel Example.
Review • Write a raw score regression equation with 2 IVs in it. Describe terms. • Describe a concrete example where you would use multiple regression to analyze the data. • What does R2 mean in multiple regression? • For your concrete example, what would an R2 of .15 mean? • With 1 IV, the IV and the predicted values correlate 1.0. Not so with 2 or more IVs. Why?
Significance Test for R2 When the null is true, result is distributed as F with k and (N-k-1) df. In our example, R2 = .61, k = 2 and N = 20. F(α=.05,2,17)=3.59.
The Problem of Variable Importance With 1 IV, the correlation provides a simple index of the ‘importance’ of that variable. Both r and r2 are good indices of importance with 1 IV. With multiple IVs, total R-square will be the sum of the individual IV r2 values, if and only if the IVs are mutually uncorrelated, that is, they correlate to some degree with Y, but not with each other. When multiple IVs are correlated, there are many different statistical indices of the ‘importance’ of the IVs, and they do not agree with one another. There is no simple answer to questions about the importance of correlated IVs. Rather there are many reasonable answers depending on what you mean by importance.
R R Y Y X1 X1 X2 X2 Y Y 1 1 X1 X1 .50 .40 1 1 X2 X2 .50 .60 .30 .00 1 1 Venn Diagrams {easy but not always right} Fig 1. IVs uncorrelated. Fig 2. IVs correlated. r2 for X1, Y. R2=.52+.62=.61 R2=.32 R2 .16+.25 = .41 What to do with shared Y?
More Venn Diagrams Desired state Typical state In a regression problem, we want to predict Y from X as well as possible (maximize R2). To do so, want X variables correlated with Y but not X. Hard to find, e.g., cognitive ability tests.
Each X has a raw score slope, b. Slope tells expected change in Y if X changes 1 unit*. Large b weights should indicate important variables, but b depends on variance of X. A b for height in inches would be 12 times larger than b for height in feet. If we standardize X and Y, all units of X are the same. Relative size of b now meaningful. Raw & Standardized Regression Weights *strictly speaking, holding other X variables constant.
Y x1 x2 Y 1 x1 0.73 1 x2 0.68 0.64 1 Computing Standardized Regression Weights Standardized regression weight aka beta weight. Poor choice of names & symbols. With 1 IV, . If you have a correlation matrix, you can calculate beta weights (standardized regression weights). What is r12? What impact?
Calculating R2 Sum of squared simple (zero order) r. Product of standardized regression weight and r. This is really interesting because the sum of products will add up to R2 and because r, , and the product of the two are all reasonable indices of the importance of the IV.
Y x1 x2 Y 1 x1 0.73 1 x2 0.68 0.64 1 Calculating R2 (2)
Review • What is the problem with correlated independent variables if we want to maximize variance accounted for in the criterion? • Why do we report beta weights (standardized b weights)? • Describe R-square in two different ways, that is, using two distinct formulas. Explain the formulas.
Tests of Regression Coefficients (b Weights) Each slope tells the expected change in Y when X changes 1 unit, but X is controlled for all other X variables. Consider Venn diagrams. Standard errors of b weights with 2 IVs: Where S2y.12 is the variance of estimate (variance of residuals), the first term in the denominator is the sum of squares for X1 or X2, and r212 is the squared correlation between predictors.
Tests of b Weights (2) SSres=9.42 For significance of the b weight, compute a t: Degrees of freedom for each t are N-k-1.
Tests of R2 vs Tests of b • Slopes (b) tell about the relation between Y and the unique part of X. R2 tells about proportion of variance in Y accounted for by set of predictors all together. • Correlations among X variables increase the standard errors of b weights but not R2. • Possible to get significant R2, but no or few significant b weights (see Venn diagrams). • Possible but unlikely to have significant b but not significant R2. Look to R2 first. If it is n.s., avoid interpreting b weights.
Review • How is it possible to have a significant R-square and non-significant b weights? • Write a regression equation with beta weights in it. Describe terms.
Testing Incremental R2 You can start regression with a set of one or more variables and then add predictors 1 or more at a time. When you add predictors, R2 will never go down. It usually goes up, and you can test whether the increment in R2 is significant or else if likely due to chance. =R-square for the larger model =R-square for the smaller model = number of predictors in the larger model =number of predictors in the smaller model
Examples of Testing Increments Suppose we start with 1 variable and R-square is .52. We add a second variable and R-square increases to .67. We have 20 people. Then p<.05 Suppose we start with 3 IVs and R-square is .25. We add 2 more IVs in a block and R-square climbs to .35. We have 100 people. Then: p <.05
Another Look at Importance • In regression problems, the most commonly used indices of importance are the correlation, r, and the increment to R-square when the variable of interest is considered last. The second is sometimes called a last-in R-square change. The last-in increment corresponds to the Type III sums of squares and is closely related to the b weight. • The correlation tells about the importance of the variable ignoring all other predictors. • The last-in increment tells about the importance of the variable as a unique contributor to the prediction of Y, above and beyond all other predictors in the model. • You can assign shared variance in Y to specific X by adding variable to equations in order, but then the importance is sort of arbitrary and under your influence. • “Importance” is not well defined statistically when IVs are correlated. Doesn’t include mediated models (path analysis).
Review • Find data on website – Labs, then 2IV example • Find r, beta, r*beta • Describe importance