Download
1 / 49
490 likes | 628 Vues
Galaxy Populations Laerte Sodré Jr. Departamento de Astronomia Universidade de São Paulo São Paulo, Brazil. Formation of Structure in the Universe LENAC + XIII IAGUSP Advanced School of Astrophysics, 2006, April 6-14 Foz do Iguaçú, Brazil. Motivation.

E N D
Galaxy Populations Laerte Sodré Jr. Departamento de Astronomia Universidade de São Paulo São Paulo, Brazil Formation of Structure in the Universe LENAC+XIII IAGUSP Advanced School of Astrophysics, 2006, April 6-14 Foz do Iguaçú, Brazil
Motivation • stellar populations (Baade, 1944): powerful concept to understand our Galaxy • galaxy populations: clues on the formation and evolution of galaxies • This concept may help to highlight the main galaxy properties that need to be understood and explained
Outline • Hubble morphological classification • Treasure boxes: 2dFGRS & SDSS • Galaxy colors • How to understand galaxy spectra • Tools for spectral analysis • Bimodality of galaxy populations • Some properties of galaxy populations
At large scales the Universe is populated by galaxies.... What are the characteristics of this population?
Hubble morphological sequence the tuning-fork diagram (1936) late early
Hubble morphological sequence “Early and late, in spite of their temporal connotations, appear to be the most convenient adjectives available for describing relative positions in the sequence”(Hubble 1926) Two kind of structural components: disk & bulge blue & red late & early M33 M49
Hubble morphological sequence morphology: difficult to be quantitative
Hubble morphological sequence morphology: difficult to be quantitative Morphological k-correction (important for high-z galaxies)
Hubble morphological sequence morphology: difficult to be quantitative, but… • Light concentration • Profile fitting • ... • A simpler approach: • Spectral classification
Treasury Boxes: 2dFGRS and SDSS • 2dFGRS: 245591 spectra, mainly galaxies • SDSS (DR4): 6670 square degree 565715 galaxy spectra spectroscopy: complete to r = 17.77 photometry (u,g,r,i,z): complete to r = 22.2
Treasury Boxes: 2dFGRS and SDSS “Data! Data! Data!”, he cried impatiently. “I can´t make bricks without clay”.Sherlock Holmes in The Adventure of the Copper Beeches (1892) These surveys provide the clay to make the bricks of our understanding of galaxy populations
Integrated spectra • SDSS: spectra within 3 arcsec fibers ~6 h70-1 kpc at the median survey redshift, z ~ 0.1 (typically contains ~40% of a galaxy light) • be cautious about interpretation of integrated spectra!
Galaxy Colors • colors: very low-resolution spectrum • SDSS: u, g, r, i, z
Galaxy Colors • SDSS: Strateva et al. (2001): the color distribution is bimodal u*-r* = 2.22 Squares and triangles represent the two main classes found by a clustering algorithm. The crosses represent the outlier class.
Galaxy Colors • Strateva et al. (2001): This study indicates that galaxies have a bimodal u*-r* color distribution corresponding to early (E, S0, and Sa) and late (Sb, Sc, and Irr) morphological types, which can be clearly separated by a u*-r* color cut of 2.22, independent of magnitude.
Spectra & Types Galaxy colors and spectra (and Hubble types) are strongly correlated: spectral classification
Some Interesting Spectral Features (u-r)=2.73 (u-r)=1.79
What a galaxy spectrum may contain? • Emission lines - HII regions - shocks in the interstellar medium - diffuse ionized medium - AGN • Continuum - stars - nebula: free-bound & free-free emission
Emission Lines in Galaxies • When can emission lines be seen in a galaxy? - when it contains some gas - when there are ionizing sources • What can be inferred from emission lines? - the nature of the ionizing source (massive stars, AGN, …) - the chemical composition of the gas - the nebular extinction due to the presence of dust • In the case of ionization bymassive stars - the present star formation rate Osterbrock, Astrophysics of Gaseous Nebulae and AGN
Star-forming galaxies x AGN • SF: the emission-line spectrum is produced by photoionization by young,massive stars • AGN:the ionizing photons are harder than those from massive stars - they provide more heating - collisionally excited lines will be brighter than in the case of ionization by massive stars only
Star-forming galaxies x AGN M33 Circinus
Star-forming galaxies x AGN • Classification SF x AGN: diagnostic diagrams • BPT: Baldwin, Phillips & Terlevich (1981) AGN SF
Nebular extinction • Dust in star-forming regions: - atenuates the star light - reddens the star light: • the fraction of photons absorbed by dust is proportional to their frequency optical depth ~ proportional toλ-δ,δ ~ 1.8 • more photons are absorbed in the blue than in the red
Nebular extinction • theory: I0(Hα)/I0(Hβ)~2.9 (for a gas at T=104 K; does not change too much with T) • observations: in general I(Hα)/I(Hβ) > I0(Hα)/I0(Hβ): more photons are absorbed in the blue than in the red
Nebular extinction • theory: I0(Hα)/I0(Hβ)~2.9 (for a gas at T=104 K; does not change too much with T) • observations: in general I(Hα)/I(Hβ) > I0(Hα)/I0(Hβ) • this allows to estimate the nebular extinction • with the extinction law of Cardelli, Clayton & Mathis (1989): AVBalmer = 7.22 log[I(Hα)/I(Hβ) ] - 15.83
Nebular metallicity • The intensity of lines produced by metals (may) increase with metallicity • Accurate estimates require measurement of Te (e.g., using the [OIII] lines at 4363 A and 5007 A) • Problem: for high abundances the line at 4363 A is too faint to be measured because nebular temperatures are too low! • Empirical methods: in general calibrated for O/H abundance through population synthesis and photoionization models and/or observations of HII regions of known metallicity references: Stasinska (astro-ph/0207500), Pettini & Pagel (2004)
Nebular metallicity • Empirical methods: R23 indicator calibration of Tremonti et al. 2004: 12+log(O/H)=9.185-0.313x-0.264x2-0.321x3 x = log(R23)
Nebular metallicity • Empirical methods: N2 indicator Solar value: 8.66 Pettini & Pagel (2004)
Nebular metallicity • Empirical methods: O3N2 indicator Solar value: 8.66 Pettini & Pagel (2004)
Star-formation rate • Young stars ionize the gas • Hα: emitted by stars with ages < 107 -108 yr • The star-formation rate (SFR) can be estimated from the Hα luminosity emitted by HII regions (calibrated with models) SFR=7.9 x 10-42 L(Hα ) Msun yr-1 (for L(Hα ) in erg/s)
Star-formation rate (Mateus et al. 2006) The EW(Hα) is an excellent indicator of the specific star-formation rate
Stellar masses & star-formation histories • Kauffmann et al. (2003): uses two stellar absorption-line indices- the 4000 A break strength and the Balmer absorption-line index HδA- calibrated with models of different star-formation histories • The method provides: M/L, M*, stellar extinction by dust (through model x observed colors)
Stellar masses & star-formation histories bursts Continuous SF histories
Stellar masses & star-formation histories bimodality Kauffmann et al. (2003): most of stellar mass in the local Universe resides in galaxies that have stellar masses ~5 x 10¹⁰ Msun, half-light radii ~3 kpc, and half-light surface mass densities of 109 Msun kpc-2.
Spectral Synthesis • Cid Fernandes et al. (2005) • A galaxy spectrum encodes information on the age and metallicity distributions of the constituent stars • Then, it is an expression of the galaxy star-formation and chemical history • SS allows to retrieve physical properties of galaxies
Spectral Synthesis • Fitting of an observed spectrum Oλ with N* SSP from the evolutionary synthesis models of Bruzual & Charlot (2003) • Extinction is modeled as due to foreground dust, parametrized by AV • LOS stellar motions broadens spectral lines and are modeled by a Gaussian centered at velocity v* and with dispersion σ*
Spectral Synthesis A spectral base: bursts of star-formation (from Bruzual & Charlot 2003)
Spectral Synthesis Cid Fernandes et al. 2005
Spectral Synthesis:some results Cid Fernandes et al. 2005
The bimodal character of galaxy populations Kauffmann et al (2003b): low-redshift galaxies divide into two distinct families at a stellar mass of ~3 × 10¹⁰ Msun Lower-mass galaxies have young stellar populations, low surface mass densities and the low concentrations typical of discs
The bimodal character of galaxy populations Note that AGN-hosts form an intermediate population (Mateus et al. 2006)
The bimodal character of galaxy populations Mateus et al. (2006)
Bimodality at high-z Combo-17: Bell et al. (2004), Deep2: Willmer et al. (2004)
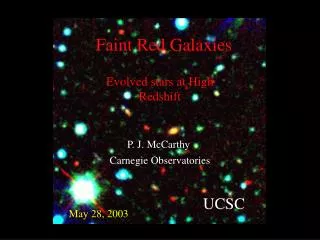
The downsizing of galaxy populations - Cowie et al. (1996): massive galaxies were formed at high redshift - massive galaxies formed the bulk of their stars in the first ~3 Gyr of the universe (McCarthy et al. 2004, Kodama et al. 2004, Juneau et al. 2005) Mateus et al. (2006)
The luminosity-metallicity relation More massive (luminous) galaxies have more metals Tremonti et al. 2004
Other talks: • Evolution of bimodality • Environmental effects • Galaxy properties • The AGN-galaxy connection • Theory! How do the bimodality appear?
Summary • Hubble morphological classification: early & late types • Treasury boxes: 2dFGRS & SDSS • Bimodality of galaxy populations: colors, stellar mass, extinction, etc • Some properties of galaxy populations: - downsizing of galaxy populations - luminosity-metallicity relation It is a capital mistake to theorize before you have all the evidence. It biases the judgement. Sherlock Holmes in A Study in Scarlet (1887)