Flood vulnerability analysi using remote sensing and gis BY
590 likes | 864 Vues
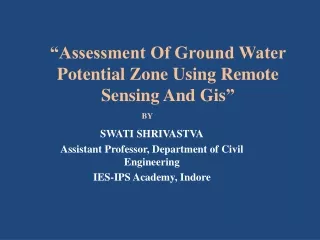
Flood vulnerability analysi using remote sensing and gis BY. 1 AKINGBOGUN,A.A,2 S.O.A.KOSOKO 1 DEPARTMENT OF SURVEYING AND GEOINFORMATICS 2 DEPARTMENT OF GEOINFORMATICS FEDERAL SCHOOL OF SURVEYING P.M.B 1024 OYO Corresponding Author: Email: embrace_ayoola07@yahoo.com

Flood vulnerability analysi using remote sensing and gis BY
E N D
Presentation Transcript
Flood vulnerability analysi using remote sensing and gis BY 1 AKINGBOGUN,A.A,2 S.O.A.KOSOKO 1 DEPARTMENT OF SURVEYING AND GEOINFORMATICS 2 DEPARTMENT OF GEOINFORMATICS FEDERAL SCHOOL OF SURVEYING P.M.B 1024 OYO Corresponding Author: Email: embrace_ayoola07@yahoo.com Telephone:234-8032379644
Introduction • To map out the different land use /land cover and their spatial distribution • To identify and map out changes over the space of 21 years using Landsat TM • To assess the land use change pattern’s impact on surface water resources • To examine specific human activity types responsible for the changes
METHODOLOGY • The techniques used in carrying out the study are data acquisition, processing and information presentation. Spatial data play an important role in any Geographic information system project, Cadastral map of the study area was collected from the Ministry of Lands and Survey Ibadan, and the climatic data (rainfall) for several years (10 years), between [1997-2007] was collected from IITA
Buffer generation • The river was buffered at a distance of 500m using multiple rings of 20 and distance between rings 25m. The operation was performed using the distance operation in the operation list. The area was classified into four flooding zones namely: highly vulnerable, moderately vulnerable, lowest vulnerable and not vulnerable, using buffer distance as the only flood zoning parameter.
Having acquired all the necessary data, the GIS operation performed are: buffering,overlay operation by intersection and clipping for the creation of the geographic data base of the study area.The setback criteria used were set in line with Town and Country Planning Building Regulation of 1996. The following are the classification used in highly vulnerable= 25m, moderately vulnerable= 50m, Lowest vulnerable=75, Not-vulnerable= 100m
Introduction • To map out the different land use /land cover and their spatial distribution • To identify and map out changes over the space of 21 years using Landsat TM • To assess the land use change pattern’s impact on surface water resources • To examine specific human activity types responsible for the changes
Generation of Dem and 3D scene The digitized contours from the topographical map of the study area were used to generate the digital elevation model. The Digital Elevation Model (DEM) generated was projected on a 3D scene in order to see the terrain configuration of the area in perspective view. Buildings, Rivers, and Roads were draped on the DEM in order to show their location along the plain, the map generated from the above operation
GIS AND REMOTE SENSING AN EFFECTIVE TOOL FOR FOREST RESERVE DEGRADATION MONITORING BY 1 AKINGBOGUN,A.A,2 S.O.A.KOSOKO 1 DEPARTMENT OF SURVEYING AND GEOINFORMATICS 2 DEPARTMENT OF GEOINFORMATICS FEDERAL SCHOOL OF SURVEYING P.M.B 1024 OYO Corresponding Author: Email: embrace_ayoola07@yahoo.com Telephone:234-8032379644
_ USING RS/GIS _ • Abstract • Remote Sensing Technology in combination with Geographic Information System can render reliable information on land use dynamics. This study therefore examined the integration of Remote Sensing and Geographic Information System (RS/GIS) for application in urban growth effects on the Eleyele Forest Reserve in Ibadan, Oyo State. The 1972, 1984 and 2000 Landsat TM satellite Remote Sensing data was used to identify and classify Eleyele Forest Reserve. A GIS database of land use categories and their location within 28 years (1972-2000) was generated and analyzed with the aid of GIS analytical functions.
_ USING RS/GIS _ • These include Area calculation, overlay, image differencing, Markov operation, and cross tabulation. The result showed that population growth (anthropogenic factors) among communities around the forest imposes a lot of pressure on the forest plantation. Forest reserve has suffered seriously and if the present trend of deforestation continues; it is just a matter of time when the whole reserve would have been converted to a bare ground.
Introduction • Pressures on forest especially in the tropical world to provide economic resources have been increasing rapidly as a consequence of burgeoning population in the region. This has led to unabated deforestation, which has been recognized as one of the major drivers of biodiversity loss as well as a threat to the existence of the global ecological lung.
Ibadan, the Oyo state capital has witnessed remarkable expansion growth and development activities such as building and road construction. Fig.1 shows the gradual spatial growth of Ibadan from 1963-1981 (Ayeni Bola). He identified several factors responsible for such growth as: • i. Headquarters of western province • ii. Construction of Lagos-Ibadan Express way that generated the greatest urban sprawl (East and West). • Construction of Eleyele Express way (West) • Increased in agricultural activities • Trading and craft
The forest reserve is now a place of spiritual activities such as construction of churches, many unauthorized residential building have been erected, and various types of agricultural activities are now taking place. There is illegal cutting of timbers, illegal harvesting of wood for firewood, sand excavation and block making industries. Something has to be done, we must understand the magnitude of the exploitation and estimate the trend, what are the agent of deforestation and begin to project occurrences in the nearest future if nothing is done. The project therefore, examines forest plantation degradation .land use and land cover changes in Eleyele catchments area of Ibadan using GIS as a tool to assess changes over a 28 years period (1972 – 2000) of time in the study area.
Using RS/GIS • These have led to a tremendous increase in the population of the city. There is an increase demand for land and this has led to gradual deforestation of the watershed. The forest reserve is now a place of spiritual activities such as construction of churches, many unauthorized residential building have been erected, and various types of agricultural activities are now taking place. There is illegal cutting of timbers, illegal harvesting of wood for firewood, sand excavation and block making industries. Something has to be done, we must understand the magnitude of the exploitation and estimate the trend, what are the agent of deforestation and begin to project occurrences in the nearest future if nothing is done. The project therefore, examines forest plantation degradation .land use and land cover changes in Eleyele catchments area of Ibadan using GIS as a tool to assess changes over a 28 years period (1972 – 2000) of time in the study area.
OBJECTIVES OF THE RESEARCH • The object of this study is to examine the integration of GIS and remote sensing for application in urban growth effects on the Eleyele forest reserve in Ibadan South West Local Government of Oyo State. • The following objectives were pursued to achieve the aim defined above • To map out the different land use / land cover and their spatial distribution • To identity, quantify and map out the forest plantation changes in Eleyele forest reserve from 1972 to 2000 using LANDSAT images. • Examine the specific human activity types responsible for the changes. • To demonstrate the capabilities of GIS in the area of classification and overlay in the study of deforestation. • To perform NDVI calculation, showing vegetation reflectance • To model / predict possible future changes
JUSTIFICATION FOR THE RESEARCH • In general, the aim of managing any resources is to find a way to ensure its sustainability. To understand why deforestation is such a dangerous practice and should be discontinued forth with, forest plantation must first be given credit for the role they play or their impact on the local ecosystem. • The forest plantation in Eleyele catchments area was established to be preserved: • (i). as a protection forest to prevent erosion i.e. to protect the catchments area of the lake. • (ii). to supply building poles, telegraph poles and fuel wood on a maximum sustained annual yield basis for the benefit of the communities of Ibadan.
OBJECTIVES OF THE RESEARCH • The object of this study is to examine the integration of GIS and remote sensing for application in urban growth effects on the Eleyele forest reserve in Ibadan South West Local Government of Oyo State. • The following objectives were pursued to achieve the aim defined above • To map out the different land use / land cover and their spatial distribution • To identity, quantify and map out the forest plantation changes in Eleyele forest reserve from 1972 to 2000 using LANDSAT images. • Examine the specific human activity types responsible for the changes. • To demonstrate the capabilities of GIS in the area of classification and overlay in the study of deforestation. • To perform NDVI calculation, showing vegetation reflectance • To model / predict possible future changes
DATA ACQUISITION • three LANDSAT ETM Satellite images of Oyo state were acquired. - 1972, 1984 and 2000 with spatial resolution of 30m. Other ancillary data like topographic map were also used. All the imageries were obtained from NASRDA. • The images were then geo referenced in Arc View due to its flexibility. Subsequently the study area was cut from the whole image for the four-time period. The images were broken into subsets in Arc View and saved as Tiff images. • The geo referencing properties of 1972, 1984, 2000 and 2004 are the same. • Data Type - rgb 8 • File type – binary • Column – 535, Rows – 552 • Reference system – UTM 31 • Referencing units - meters, Unit distance – 1 • Minimum X – 582562.654651, Maximum X – 619124.711419 • Minimum Y – 798087.407848, Maximum Y – 834940.216559 • Image thinning was carried out through contract. • IMAGE CLASSIFICATION • Training sites were generated on the images by on-screen digitizing for each land cover classes derived from image of different band combination. A supervised (full Gaussian) maximum likelihood classification was implemented for the four images. This was due to the fact that the operator has familiarized himself with the study area through dedicated field observation, whereby the spectra characteristics of the classes in the sampled area has been identified. Ground truth information was used to assess the accuracy of the classification.
PHYSICAL DESIGN • The software used is the ArcGIS which uses number, string, Boolean and date for declaration of data types. • The data processing in this study involves conversion of analog maps of the project area into digital. This was done by scanning the maps and vectorizing the maps through on-screen digitizing and this was done using ArcGIS. • ArcGIS was used in creating the database. The relations/tables in the database are: Forest Plantation, Built-up-Areas, Farmland, Vegetation, and Water body within the study area. The semantic data of each entity was entered into the tables for spatial query
METHOD OF DATA ANALYSIS • Seven main methods of data analysis were adopted in this study. • Calculation of the area in hectares of the resulting land use/land cover types for each study year and subsequently comparing the result. • Overlay operations. – i.e. mathematical and logical operation between two raster layers on a pixel to pixel basis. • Image differencing – to provide for change analysis through differencing of images pairs. • Cross tab. – to determine all unique combinations of value in two qualitative images and calculate similarity statistics • Database query and hot linking • Markovian transition estimator for predicting future change. • Normalized difference vegetation index. • The first three methods will be used to identify changes in the land use types. The comparison of the land use/land cover statistics will assist in identifying the percentage change, trend and rate of change between 1972 and 2004.
Data were acquired from a number of sources. Since the nature of land cover monitoring requires images of different time period, and that change detection analysis is carried out most effectively with not less than 3 images of the study area, three LANDSAT ETM Satellite images of Oyo state were acquired. - 1972, 1984 and 2000 with spatial resolution of 30m. Other ancillary data like topographic map were also used. All the imageries were obtained from NASRDA. In achieving this, the first task was to develop a table showing the area in hectares and the percentage change for each year 1972, 1984, 2000 and 2004 measured against each land use/land cover type. Percentage change to determine the trend of change can then be calculated by dividing observed change by sum of changes multiplied by 100. • (Trend) percentage change = observed change X 100 • Sum of change
In order to obtain the area extent (in hectares) of the resulting land use / land cover type for each study year and for subsequent comparison, the GIS analysis in database query (AREA) of Idrisi software was carried out. • Tabulation and area calculations provided a comprehensive dataset in term of the overall land scope and the type and the amount of changes that have occurred. Table 4 shows the spatial extent of land cover in hectares and in percentages. Table 5 shows the annual rate of increase/decrease of activity type. Table 6 shows the percentage range of Land cover, 1972-1984, 1984-2000.
A supervised (full Gaussian) maximum likelihood classification was implemented for the four images and the final classification products provide an overview of the major land use / land cover features of Eleyele forest reserve for the year 1972, 1984, 2000 . • Five categories of land use / land cover were identified; these are: built up area, farmland, forest plantation, vegetation and water body. Figure 3, 4, 5 and 6 illustrate the land use / land cover map of Eleyele forest reserve for the year 1972, 1984, and 2000.
IMAGE DIFFERENCING – CHANGE DETECTION ANALYSIS • Two classified images (1984/2000) and (1972/1984) were compared i.e. a pair of images compared to identify areas that have distinctly different brightness values. New images representing change were created by taking the difference between images. The basic premise of change detection is that spectra signature change is commensurate with changes in land cover. Change detection analysis was better done in ERDAS IMAGINE. • The new images that represent changes were listed in fig.10. Brightness values are represented as a digital number DN 0-255 in a color image separate red, green and blue values are measured.
CROSS TABULATION OPERATION • Cross tab performs two operations: • Image cross tabulation and Cross classification • Categories of image 1972 were compared with those of 2000 and image of year 2000 was also compared with image of 1984 and tabulation is kept of the number of cells in each combinations. The result of this operation is a table as shown in table 8 listing the tabulation total as well as several measures of association between the images. The first of these measures is CRAMER’S V, a correlation co-efficient that ranges from 0.0 indicating no correlation to 1.0 indicating perfect correlation. • A chi-square statistics is output along with the appropriate degree of freedom (df 16) and the significance of the Cramer’s V was tested. If the chi-square is significant so it is Cramer’s V. • Since the 2 images have exactly the same number of categories, another measure of association called Kappa was output.
The 1972, 1984, and 2000 land use / land cover practice in this depleting Eleyele Forest Reserve were determined in order to ascertain the causes of deforestation. Five major classes were identified and classified as the land use/cover of all the five images as follows: built up areas, farmland, forest plantation, vegetation and water body. However, amongst these five major classes, three classes were identified as land use practices that is heavily depleting the reserve; they are built up area i.e. settlement, farmland and degraded forest which is called vegetation in this study. Fig. (4), (5), (6) and (7) illustrate this respectively. Built up area alone account for more than 15% of deforestation in 1972 and up to 25% in year 2000 while farmland account for more than 69.77% of deforestation in year 2000, vegetation account for more than 80% of deforestation in the study area. All these activities were leading to degradation of the forest plantation which is called deforestation. • AREA OF LAND USE / LAND COVER CLASSES LOST TO OTHER CLASSES • It was discovered that there is a large decrease in forest plantation between 1984 and 2000 from 0.8808 hectares of forest plantation (12.5%) to 0.0094 hectares of forest plantation (0.13%) which is a loss of about 0.8714 hectares or 12.37%. Also there was a tremendous decrease in vegetation from 1972 to year 2000 i.e. from 5.8 hectares of land in 1972 to 1.5 hectares in 1984 to 0.04 hectares in year 2000. This is as a result of vegetation classes being converted to farmland. DISCUSSION OF FINDINGS
DISCUSSION OF FINDINGS AREA OF LAND USE / LAND COVER CLASSES GAINED BY OTHER CLASSES It was found that built up areas, farmland and vegetable increased tremendously in size from 1984 to 2000 (16 years) i.e. for good sixteen years so many buildings were constructed in the reserve, such as churches, mechanic workshop, bricklaying industries; at the same period of time farming activities was on the increase and vegetation size which occurs as a result deforestation was the order of the day. Built up area increased from 0.7762 hectares (11.02%) to 1.7706 hectares (25.14%), farmland area increased from 3.7080 hectares (52.66%) to 4.9127 hectares (69.77%), vegetation area increased from 0.414 hectares (0.59%) in year 2000 to 3.3142 (47%). The annual rate of increase of built up area, farmland area and vegetation was on the positive 0.2, 0.88 and 1.07 whereas the annual rate of increase of forest plantation was on the negative -0.04. In 1972 vegetation occupied 82.48% of the total land area as a result of a prior harvesting of wood for timber. In 1984 deforestation for farmland took 52.66% of the total land area and contributed most to deforestation. This increase in agricultural activities continued in year 2000.
DISCUSSION OF FINDINGS • OVERLAY OF LAND USE MAP FOR CHANGE DETECTION • By overlaying the result of the classification, the maps of the occurred changes between 1972 to 1984, 1984 to 2000 and 1972 to 2000 are resulted as shown in figures 17 and 18. From these maps it can be seen how much of the reserve has been depleted, where the depletion has occupied and the type of land use practice in those area which must have caused the degradation. • Addition, the pattern and spatial distribution of the phenomenon is also illustrated. NDVI values range from -1.0 +1.0 NDVI values between -1.0 and 0 represent non vegetative features such as bare surface, built up area and water body concisely greater than 0 display vegetative cover. In other to find out the changing pattern of vegetation during 1972 and 1984 both images were crossed in Idrisi. Figure 14, 15 and 16. Figure 17 shows both periods of NDVI images 1972 and 1984 it shows that high reflectance of vegetation was seen in 1984 image of the study area with increase in NDVI values. Conversely vegetation reflectance is low in 2000 image likewise in NDVI value.
Using RS/GIS • SUMMARY AND CONCLUSION • The 1972, 1984, 2000 TM satellite remote sensing data were used to identify, classify assess and interpret Eleyele Forest Reserve Plantation Degradation in North West Local Government of Ibadan in Oyo State of Nigeria. A GIS database of land use / land cover categories and their changes within 28 years (1972-2000) was generated and analyzed. The result showed that in general the forest plantation was retreating due to several anthropogenic activities of man such as illegal felling of wood, farming activities. • The rates at which the reserve is been degraded have made the area a shadow of their former selves. The local communities show that at the rate at which the degradation of the reserve is going on, the conversion of the forest plantation to a bare ground is just a matter of time. • From this study, Land Sat TM data are important sources of imagery data for mapping and monitoring the dynamics of land use / land cover in tropical rain forest. • _
Using RS/GIS • RECOMMENDATIONS • Deforestation is not an unstoppable or irreversible process. Increased and concerted efforts in forest plantation ‘rebirth’ and rejuvenation will bring to use the type of forest reserve we envisaged. In order to reduce the effects of deforestation in Eleyele forest reserve in Ibadan Nigeria the study has the followings as its recommendations: • Government by way of policy should be strict in preserving forest reserves from illegal occupation. • The promotion of alternative energy source for fire wood in order to reduce the pressure on the forest. • Development and promotion of trade in non timber forest product to reduce the pressure on timber resources and to enhance rural livelihood. • It is strongly recommended that any form of forest plantation degradation should be stopped forthwith, having realized the purpose for which the reserve was meant for. • The available vegetation area and the farmland must be converted into forest plantation of exotic fast growing species. • Lastly, the technology of remote sensing and GIS should be employed in major studies, concerning national issue such as deforestation, desertification etc.