Download

1 / 47
470 likes | 644 Vues
Standard Verification Strategies Proposal from NWS Verification Team . NWS Verification Team Draft 03/23/2009. These slides include notes, which can be expanded with your feedback. Overview. Verification goals Key metrics and products for goal #1: How good are the forecasts?

E N D
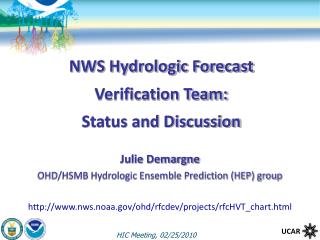
Standard Verification StrategiesProposal from NWS Verification Team NWS Verification Team Draft 03/23/2009 These slides include notes, which can be expanded with your feedback
Overview • Verification goals • Key metrics and products for goal #1: How good are the forecasts? • Key metrics and products for goal #2: What are the strengths and weaknesses in the forecasts? • Key verification analysis for goal #3: What are the sources of error/uncertainty in the forecasts? • Recommendations for goals #4 and 5: How is new science improving the forecasts? What should be done to improve the forecasts? • Examples of verification products (add examples if you want) Please send your feedback to Julie.Demargne@noaa.gov
Verification Goals Verification helps us answer questions such as 1) How good are the forecasts? Several aspects in quality => several metrics Multiple users => several levels of sophistication 2) What are the strengths and weaknesses in the forecasts? Several conditions to verify subsets of forecasts Several baseline forecasts for comparison 3) What are the sources of error/uncertainty in the forecasts? Several scenarios to separate different sources of uncertainty 4) How is new science improving the forecasts? Comparison of verification results from current process vs. new process 5) What should be done to improve the forecasts?
Verification Goals Verification activity has value only if the information generated leads to a decision about the forecast/system being verified User of the information must be identified Purpose of the verification must be known in advance No single verification measure provides complete information about the quality of a forecast product Different levels of sophistication with several verification metrics and products To inter-compare metrics across basins and RFCs, they should be normalized
Goal #1: How good are the forecasts? • Different aspects in forecast quality • Accuracy(agreement w/ observations) • Bias in the mean(forecast mean agrees with observed mean) • Correlation(linear relationship between forecasts and obs.) • Skill(more accurate than reference forecast) • Reliability(agreement between categories; conditioned on fcst) • Resolution(discriminate between events and non-events; conditioned on observations) • Sharpness for probabilistic forecasts (prediction with strong probabilities) • Need to compare deterministic and probabilistic forecasts for forcing inputs and hydrologic outputs
O !O F TP FP !F FN TN Goal #1: Key verification metrics • Proposed key verification metrics to analyze different aspects in forecast quality: for deterministic forecasts • Accuracy: Mean Absolute Error (MAE) (equivalent to CRPS) • Bias: Mean Error (ME) (or relative measures) • Correlation: Correlation Coefficient (CC) • Skill: MAE-Skill Score w/ reference (MAE-SSref) • Reliability: for 1 given event False Alarm Ratio FAR=FP/(TP+FP) • Resolution: for 1 given event Probability of Detection POD=TP/(TP+FN)Probability of False Detection POFD=FP/(FP+TN) ROC plot (POD vs. POFD) and ROC Area
Goal #1: Key verification metrics • Proposed key verification metrics to analyze different aspects in forecast quality: for probabilistic forecasts • Accuracy: Mean Continuous Rank Probability Score (CRPS) to be decomposed CRPS = Reliability - Resolution + Uncertainty; Brier Score (BS) for 1 given threshold (e.g., PoP) • Reliability: ReliabilityCRPS, Cumulative Talagrand diagram, Reliability diagram for 1 given event • Resolution: ResolutionCRPS, ROC plot (POD vs. POFD) and ROC Area for 1 given event • Skill: CRPS Skill Score w/ climatology (CRPSSclim), Brier Skill Score (BSSclim) for 1 given threshold • For forecast mean: bias MEmean and correlation CCmean
Goal #1: Key verification metrics • Other key verification metrics: timing error, peak error, shape error (under development) • Process to pair forecasts and observations based on event (no longer forecast valid time) • Technique from spatial verification or curve registration to be adapted Peak Timing Peak Value, Shape OBS OBS FCST FCST
Event No event Action C C No Action L 0 Goal #1: Key verification metrics • Other verification metric to describe forecast value: Relative Value (or Economic Value) is a skill score of expected expense using Cost/Loss ratio, w/ climatology as a reference Expense matrix for 1 event cost C and loss L for taking action based on a forecast Envelop: potential value w/ all event thresholds to be multiplied by contingency table to get expense for this event 1 user would pick its own Cost/Loss ratio See website http://www.bom.gov.au/bmrc/wefor/staff/eee/verif/verif_web_page.html
Goal #1: Key verification metrics • Normalized verification metrics to inter-compare results at different forecast points (and across RFCs) • Thresholds: • specific percentiles in observed distribution (e.g., 10th percentile, 25th percentile, 90th percentile) • specific impact thresholds (e.g., Action Stage, Flood Stage) • Skill scores: • Choice of metric: MAE / CRPS • Choice of reference: persistence, climatology (to be defined) • Relative measures (needs more work): • Relative bias = ME/(obs. mean) • Percent bias = 100 x [Sum(Fi – Oi) / Sum(Oi)]
Goal #1: Key verification products • Multiple users of forecasts and verification information • different levels of sophistication for verification metrics/plots • different levels of spatial aggregation to provide verification info for individual forecast points and for groups of forecast points (up to RCF areas) • different levels of time aggregation to provide verification info from last “days” and from last “years”
Goal #1: Key verification products • Proposed verification metrics/plots for 3 levels of sophistication • Summary info • Accuracy: MAE and CRPS • Bias: ME • Skill: MAE-SSref and CRPSSclim • Detailed info: • Scatter plots (deterministic forecasts), box-whisker plots (probabilistic forecasts) • Time series plots for deterministic and probabilistic forecasts • Sophisticated info: • Reliability: FAR (for 1 given event), ReliabilityCRPS, Cumulative Talagrand Diagram, Reliability Diagram (for 1 given event) • Resolution: ROC and ROC Area (for 1 given event), ResolutionCRPS • Forecast value: Relative Value
Goal #1: Key verification products • Proposed verification metrics/plots • Summary info could be based on • a few key metrics/scores (more than 1 metric) • a combination of several metrics into one plot • a combination of several metrics into one score (TBD) Example of 2D plot: different metrics vs. lead times or time periods Example of bubble plot from OHRFC Lead time ROC Area Skill MAE ME MAE ME http://www.erh.noaa.gov/ohrfc/bubbles.php
Goal #1: Key verification products • Proposed verification metrics/plots • Detailed info for current forecast: time series plot displayed w/ forecasts from the last 5-10 days provides basic information on • forecast agreement with observation in recent past • forecast uncertainty given the previous forecasts • Detailed info for ‘historical’ event: time series plots for specific events selected from the past • Time series plots for probabilistic forecasts (with all lead times): no example yet
Goal #2: What are the strengths and weaknesses? • Forecast quality varies in time based on different conditions => different subsets of forecasts need to be verified to see how quality varies • Time of the year: by season, by month • Atmospheric/hydrologic conditions: by categories defined from precipitation/temperature/flow/stage observed or forecast values (e.g., high flow category if flow >= X) • Forecast quality needs to be compared to baseline => different baseline forecasts to compare with • Persistence, climatology
Goal #2: Key verification products • Verification statistics/products produced for different conditions • for each season and for each month • for different atmospheric and/or hydrologic conditions; categories to be defined from precipitation, temperature, flow, stage observed or forecast values • Categories defined from specific percentiles (e.g., 25th percentile, 75th percentile) • Categories defined from specific impact thresholds (e.g., Action Stage, Flood Stage) • Impact of sample size on results: plot sample sizes; plot verification stats with confidence intervals (under development)
Goal #3: What are the sources of uncertainty? • Forecast error/uncertainty comes from different sources: • forcing inputs • initial conditions • model parameters and structure • These uncertainty sources interact with each other • Different forecast scenarios are needed to analyze how these different sources of uncertainty impact the quality of hydrologic forecasts • Hindcasting capability to retroactively generate forecasts from a fixed forecast scenario with large sample size • Work under way to better diagnose sources of uncertainty
Goal #3: Key verification analysis • Analyze impact of forcing input forecasts from 2 different sources or durations on flow (or stage) forecast quality • Generate ‘forecast’ flow w/ input forecast sets 1 and 2 using same initial conditions (wo/ on-the-fly mods) and same model • Generate ‘simulated’ flow from observed inputs using same initial conditions and same model • Compare flow forecasts w/ observed flow (impact of hydro. + meteo. uncertainties) and w/ simulated flow (impact of hydro. uncertainty mostly): the differences in results are due to meteorological uncertainty mostly if interaction between meteo. and hydro uncertainties is not significant
Goal #3: Key verification analysis • Analyze impact of run-time mods on flow (or stage) forecast quality • Define reference model states (to be discussed; could use model states valid at T – 5 days, even if it includes past mods) • Defined basic mods to include (e.g. for regulated points) • Generate flow forecasts from reference model states w/ best available observed inputs (but no forecast input) wo/ on-the-fly mods and w/ on-the-fly mods • Generate flow forecasts from reference model states w/ best available observed and forecast inputs wo/ on-the-fly mods and w/ on-the-fly mods
Goals #4 and 5:How is new science improving the forecasts? What should be done to improve the forecasts? • The impact of any (newly developed) forecasting process on forecast quality needs to be demonstrated via rigorous and objective verification studies • Verification results form the basis for accepting (or rejecting) proposed improvements to the forecasting system and for prioritizing system development and enhancements • This will be easier in the future • when verification standards are agreed upon • when a unified verification system for both deterministic and probabilistic forecasts will be available in CHPS • when scientists and forecasters are trained on verification
Verification product examples User analysis is needed to identify standard verification products for the different user groups This analysis will be done with NWS Verification Team, CAT and CAT2 Teams, Interactive/Ensemble Product Generator (EPG) Requirements Team, and the SCHs New RFC verification case studies to work with proposed standards Here are verification product examples to be discussed by the NWS Verification Team and to be presented in the final team report Please send feedback to Julie.Demargne@noaa.gov
Verification product examples Summary verification maps: 1 metric for given lead time, given time period and for given forecast point(s) • Potential metrics: • deterministic forecasts: MAE, MAE-SSref, Bias • probabilistic forecasts: CRPS, CRPSSref, ReliabilityCRPS Example of MAE map MAE <= threshold X MAE > threshold X to be defined by user Click on map to get more details MAE = xxx MAE-SSclim = xxx MAE-SSpers. = xxx Bias = xxx Correlation = xxx
Verification product examples Summary verification maps w/ animation: 1 metric for several lead times, time periods (e.g. months, seasons), thresholds SON DJF MAM MAE <= threshold X MAE > threshold X JJA • Potential metrics: • deterministic forecasts: MAE, MAE-SSref, Bias • probabilistic forecasts: CRPS, CRPSSref, ReliabilityCRPS Example of MAE maps for 4 seasons
Verification product examples Summary verification maps w/ spatial aggregation: 1 metric for several levels of aggregation (segments, forecast groups, carryover groups, RFCs) MAE <= threshold X MAE > threshold X Example of MAE maps for 2 aggregation levels Forecast groups Segments
Verification product examples Examples of verification maps from NDFD verification website User selects Variable, Metric, Forecast, Forecast period (month), Lead time, Animation option Map of Bias for Minimum Temperature Map of Brier Score for POP Overall statistic + statistics on 4 regions http://www.weather.gov/ndfd/verification/
Verification product examples Detailed graphics for deterministic forecasts: scatter plots for given lead time O !O F TP FP !F FN TN IVP scatter plots for given lead time Example of comparison of 2 sets of forecasts in blue and red Data ‘behind’ contingency table Forecast value User-defined threshold Observed value
Verification product examples Detailed graphics for water supply forecasts: scatter plots for given issuance dates WR water supply website scatter plots (years identified) for different issuance dates www.nwrfc.noaa.gov/westernwater
Verification product examples Forecast distribution Highest 80th perc. 50th perc. 20th perc. Lowest • Detailed graphics for probabilistic forecasts: box-whisker plots for given lead time Example from Allen Bradley 2 user-defined thresholds
Verification product examples Forecast distribution Highest 80th perc. 50th perc. 20th perc. Lowest • Detailed graphics for probabilistic forecasts: box-whisker plots vs. time for given lead time Example from Allen Bradley x observation
Verification product examples Detailed graphics for probabilistic forecasts: box-whisker plots of forecast error vs. observations for given lead time ‘Errors’ for 1 forecast Highest 90th percentile 80th percentile 50th percentile (Median) 20th percentile 10th percentile Lowest EVS box-whisker plot for given lead time Forecast errors (F-O) —Zero error line Observation
Verification product examples Detailed graphics for probabilistic forecasts: box-whisker plots with identified dates for events of interest EVS box-whisker plot with identified dates for events of interest Ivan (09/18/04) Frances (09/09/04) Ivan Forecast errors (F-O) —Zero error line Observed value
Verification product examples Detailed graphics for deterministic forecasts: time series plots for given time period IVP time series plot for given sets of forecasts User-selected time Forecast/Observed values Time
Verification product examples Detailed graphics for water supply forecasts: historical plots for a given range of years WR water supply website historical plot
Verification product examples Detailed graphics for probabilistic forecasts: time series plots w/ box-whiskers for given time period Box-whisker plot for given ensemble time series (from ER RFCs) Overlay other ensemble time series in different colors? Forecast/Observed values Time
Verification product examples Detailed graphics for probabilistic forecasts: transform probabilistic forecasts into event forecasts and plotfor 1 given event, probability forecast and observations Examples from Allen Bradley – Event: flow volume < 6000 cfs-days Vertical lines show when event occurred f= P{Y <6000} f= P{Y <6000} 6000 0.3
Verification product examples • Verification statistical graphics: metric values vs. lead times for different sets of forecasts IVP plot for RMSE and sample size for 4 sets of forecasts Sample Size RMSE Forecast lead time
Verification product examples • Verification statistical graphics: metric values vs. forecast issuance dates for different sets of forecasts WR water supply website plot for RMSE Skill Score for different issuance dates and 5 sets of forecasts RMSE Skill Score Issuance Month
Verification product examples Verification statistical graphics: metric values vs. lead time for given time period and given forecast point(s) EVS example with Mean CRPS plot as a function of lead time Metric computed from different conditioning: - all data - subset for which obs>= x - subset for which obs>= xx - subset for which obs>= xxx Mean CRPS Forecast lead time
Verification product examples • Verification statistical graphics: metric values vs. probability threshold for given time period and given forecast point(s) Examples from Allen Bradley with Skill Scores Skill scores Probability threshold
Verification product examples • Verification statistical graphics: metric values vs. lead times w/ information on Confidence Intervals (under development) Example w/ Mean CRPS plot with Confidence Intervals (CI)
Verification product examples • Sophisticated verification graphics: Reliability diagram for given lead time and given sets of events EVS Reliability diagram for given lead time Metric computed for different events: - event >= x - event >= xx - event >= xxx Observed frequency Forecast probability Samples
Verification product examples • Sophisticated verification graphics: Reliability diagram for given 1 given event and for given lead times Reliability diagram for several lead days for 1 specific event Event: > 85th percentile (obs. distribution)
Verification product examples • Sophisticated verification graphics: ROC diagram for 1 specific event ROC for 1 specific event and for several lead days Comparison of deterministic and ensembles forecasts Event: > 85th percentile (obs. distribution) Probability of Detection POD Probability of False Detection POFD
Verification product examples Sophisticated verification graphics: 2-D plot to show metric values relative to different lead times and time periods CRPS for different lead times and different months Bias for different lead days relative to time in the year
Verification product examples Sophisticated verification graphics: 2-D plot to show metric values relative to different lead times and different thresholds Brier Score for different lead times and different thresholds (events) Event: > Xth percentile
Verification product examples • Sophisticated verification graphics: 2-D plot tocompareRelative Value (or Economic Value) for different thresholds and different sets of forecasts Example from Environment Canada Comparison between forecasts F1 and forecasts F2 Comparison of Relative Value V(F1) – V(F2) if V(F1) or V(F2) > V(Clim.) Event: > Xth perc. V(F1)>V(F2) and V(F1)>V(Clim) Threshold V(F2)>V(F1) and V(F2)>V(Clim) V(Clim)>V(F1) and V(Clim)> V(F2) Cost/Loss Ratio
Verification product examples • Other verification graphics?