Factors Influencing Grade Averages at Sacred Heart High School
Explore the correlation between gender, living situation, extracurricular activities, work hours, substance use, and grade averages among students at Sacred Heart Catholic High School.

Factors Influencing Grade Averages at Sacred Heart High School
E N D
Presentation Transcript
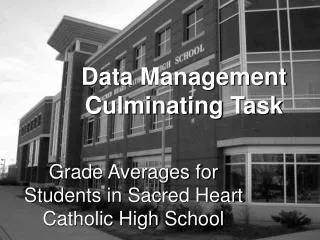
Data Management Culminating Task Grade Averages for Students in Sacred Heart Catholic High School
Thesis Statement: Sacred Heart students are more likely to have high averages (80% and above) if they: • Are female • Live with 2 people or less (not included themselves) • Participate in 2 or more sports/clubs • Work 10 hours or less a week • Do not drink alcohol or use drugs regularly
Grade Averages Grades
Grades vs. Gender Grades
Grades vs. Gender Relationship 80% and above Female 35 16 = 46% Population Female 86 36 = 42% Females are more likely to have a high average (over 80%)
Grades vs. Average Number of People Home People Home Grades
Grades vs. Number of People Home People Home Grades
Grades vs. Number of People Home Relationship 80% and above 2 or Less People Home 35 9 = 26% Population 2 or Less People Home 86 21 = 24% People who live with 2 or less people in the home (not including themselves) are more likely to have a high average
Grades vs. Average Number of Activities Activities Grades
Grades vs. Number of Activities Activities Grades
Grades vs. Number of Activities Relationship 80% and above 2 or More Activities 35 11 = 31% Population 2 or More Activities 86 24 = 28% Students who participate in 2 or more activities are more likely to have a high average.
Grades vs. Average Number of Work Hours Work Hours Grades * Only grades 11 and 12
Grades vs. Number of Work Hours Work Hours Grades
Grades vs. Number of Work Hours Relationship 80% and above Works 10 hours or less 16 6 = 38% Population Works 10 hours or less 48 20 = 42% Students who work 10 hours or less are less likely to have a high average.
Grades vs. Substance Use Substance Use Grades www.scsu.baruch.cuny.edu/. ../alcoholhome.html
Grades vs. Substance Use Relationship 80% and above No Substance Use 35 31 = 89% Population No Substance Use 86 57 = 66% Students who do not drink alcohol or use drugs are more likely to have a high average
Other Graphs Venn Diagram
Other Graphs Pictograph
Other Graphs Stem-Leaf
Other Information Mode – 79 Median – 79 Mean – 79