Download
1 / 13
140 likes | 356 Vues
Calibration (and more). Hydrology is more of an art than a science!. Calibration. Calibration process Estimation of parameter values which will minimize differences between observed and simulated streamflows Calibration problems Parameter interaction Non-unique solutions Time-consuming

E N D
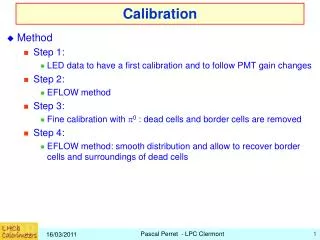
Calibration (and more) Hydrology is more of an art than a science!
Calibration • Calibration process • Estimation of parameter values which will minimize differences between observed and simulated streamflows • Calibration problems • Parameter interaction • Non-unique solutions • Time-consuming • Inaccuracies • Non-linearities • Lack of understanding
Calibration • Matching historical data • Accuracy vs. Precision • Calibration vs. Optimization
Basic Thought Process Compute Objective Function Set Initial Parameter Values Compute Hydrograph STOP New parameter estimation
An Objective Function • Some kind of measure…. • Sum of absolute residuals • Sum of the squares • % Error in Peak • Peak-weighted Root mean square error – RMS (default method).
What data do you need? • What is the final goal – Apples to Apples! • What is the 100-year flow and rainfall? • Calibrate to a similar storm • Don’t calibrate to a 1-inch rainfall if the 100-year rainfall is 7 inches! Remember how linear UHG theory is? • A real storm with real data • QA/QC – missing data filled!
Calibration System Parameter estimation/optimization and watershed simulation • Input • Point or areal estimates of historical precipitation, temperature, and potential evaporation • Initial hydrologic conditions • Output • Basin areal averages for point value inputs • Simulated hydrographs for historical analysis or use in ESP • Parameter values for models in operational forecast and ESP systems
Calibration System (continued) • Characteristics • Performs computations for few forecast points for many time steps • Uses operations table • Compatible with operational system and ESP • Produces graphical output for manual calibration • Includes algorithms for automatic optimization • Applications • Historical watershed simulation • Model calibration
Model Calibration • Strategy • Select river system • Prepare data • MAP - Mean Areal Precipitation • MAT - Mean Areal Temperature • PE - Potential Evaporation • QME - Mean Daily Discharge • QIN - Instantaneous Discharge
Model Calibration (continued) • Calibrate least complicated headwater basins • Select calibration period • Estimate initial parameter - observed Qs • Trial and error using MCP • Statistics, observed versus simulated plots • Proper approach to parameter adjustment • Automatic parameter optimization - OPT • Fine tuning - MCP • Calibrate other headwater areas • Calibrate local areas
Model Calibration (continued) • Important considerations • Model structure, simulation processes • Effects of parameter changes • Use of the forecast information
Data Preparation MAP Algorithms - Mean Areal Precipitation Techniques for converting point precipitation measurements into areal measurements and distributing them properly in time Daily and hourly data Grid point algorithm Thiessen weights Grid point versus Thiessen Two-pass algorithm - distribute daily, then estimate missing Consistency plots MAT Algorithms - Mean Areal Temperature Max - min data Grid point algorithm (1/D) Elevation weighting factor Centroid (1/DP) Conversion to mean temperatures Consistency plots MAPE - Mean Areal Potential Evaporation Evaporation pan data MAPE vs. Mean seasonal curve
Historical Data Analysis • General Information Needed • Station data on Calibration files • Station history infro - obs times, changes, location, moves • Topog map of basin MAP Specific Information Non- Mountainous Mountains --basin boundary --isohyetal map --station weights MAT Specific Information --mean max/min temperatures Non-Mountainous Mountains --basin boundary --areal-elev curve MAPE Specific Information --Evaporation maps --mean monthly evap --station weights • PXPP • check consistency • compute normals • MAT3 • check consistency • MAPE • check consistency • generate daily time • series of MAPE • TAPLOT3 • get mean max/min for • mean zone elevation • MAP3 • (re)check consistency • generate time series • of MAP • MAT3 • generate time • series of MAT Temperature Evaporation Precipitation